August 10th & 11th
360 tr days from March 6th & 9th, 2009 = 72wks or 1/2 of 144wks
275 tr days from July8th & 9th, 2009 = 55 weeks low to low
especially given that July26th was 55 wks from June 22nd ,2009 low to high
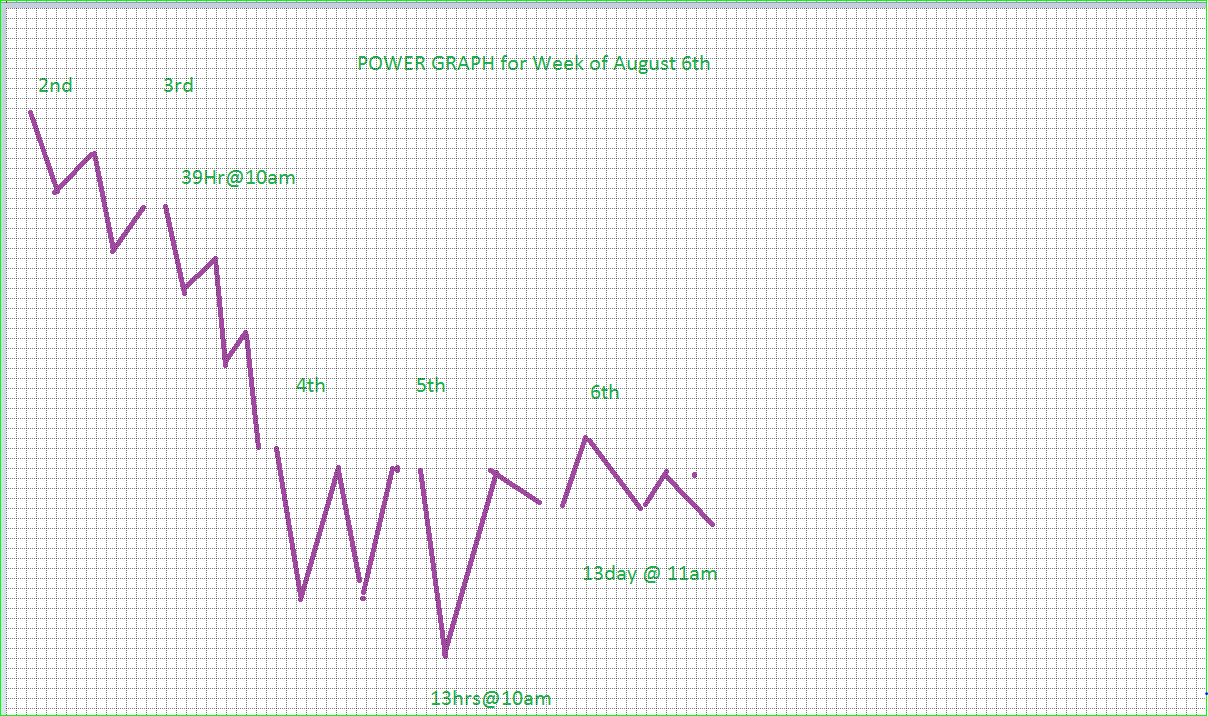
And the 11th is a Bradley date accompanied with a 39hr cycle pivot at 10am
Jay
Cool stuff, Jay.
ReplyDeleteYou might be interested in this interview:
http://commoditywatch.podbean.com/
Larry Pesavento has 5th, 11th and 26th as the most strong dated in 200 years.
I wonder how this would play out
Larry Pesavento in the audio posted at http://commoditywatch.podbean.com/ on July 14th, predicts a stock market high on August 10-12. Due to exceeding S&P 1105 his prediction for a low inverts to a high, or so he said.
ReplyDeleteall that bearish talk is actually a great catalyst for another great week for the Bull
ReplyDelete