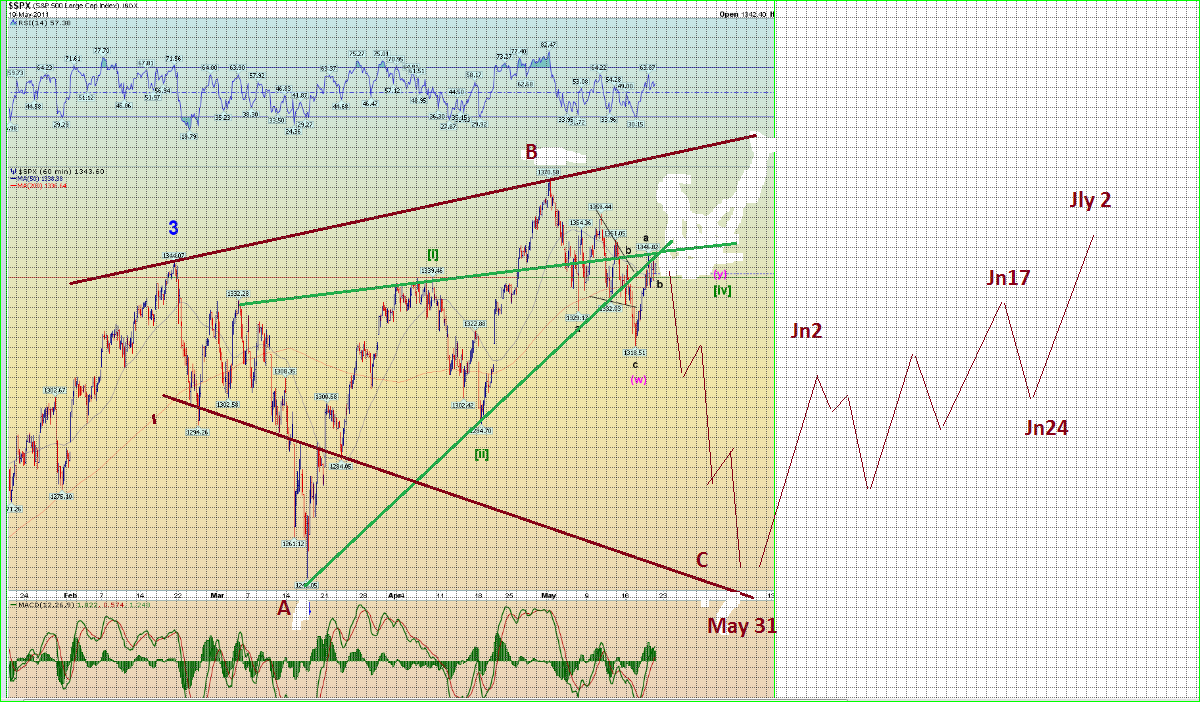

I used the graph from Danerics page to demonstrate a few things
1. IT follows the path laid out by the Elliott graph- expanded flat
2. THE 2 GREEN LINES APEX TODAY May 20th which emulates Alphie's chart, Jaywiz chart, and not shown, Spiral chart, ALL pointing to a HIGH on May 20th a BRADLEY date, and a day that has potent energy associations, noting the HYPE about the IPO for Linked in.
3. Just as the Elliott graph shows, we are reading the ENERGY for the next 10days till May 31st as very negative for stocks as well as human activities.
more later
Jay
an expanded flat needs a lower low then A... but a running flat can stop anywhere... so not sure how ugly it will get.... and imho this whole structure is an X wave
ReplyDeletesincerely,
cementzak
Yes, Cementzak thats correct.
ReplyDeleteno telling where "C" will stop.
Price levels could get to
1250
1200
1180
????????
Thats why I use TIME
SO FAR TODAY WE ARE IN PERFECT SYNC
Low at 60bars at 11am
90bars due at 1:30pm
HIGH ENERGY due at 2:18pm to 2;30
Monday opens with 126bars at 10am
Jay