 COMPARE to EKG below
Jay
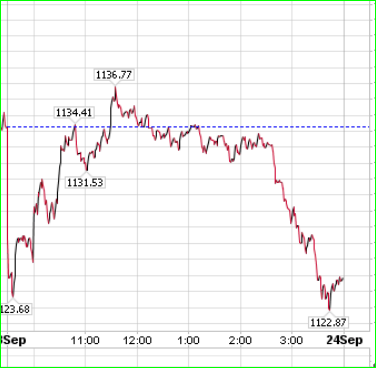
 graph from Columbia's public charts
Shows me 5 wave s DOWN from 1148 to 1123 = wave 1
Now in a rebound wave 2 till later today, probably 3 legs a,b,c
The Spt 23rd DETAILED EKG shows it the same
WAVE 3 should hit late today and Early tomrrow
as previously posted till about 11am.
WAVE 4 should last almost all day after the open tomrrow
wave 5 of this leg should occur MONDAY @10 10am .
I had projected a much deeper cut on this leg,
but it doesn't look like it will be that way.
I had mentioned 2 different scenarios- one hard & fast,
the other long and tedious.
This idea indicates the BIAS now thru early Feb has a
number of sharp retreats interspersed with sharp rallies,
offsetting each other as we make our way to a Lower trading PIVOT
Jay

i see an abc down Jay
ReplyDeletewith an impulse reversal to higher highs
sincerely
cementzak
ps: that power graph you posted seems to work for the dollar, so dollar will keep falling until monday? means market will top on monday
Cementzak
ReplyDeleteYes mkt will be Up on Monday
AFTER a weak start
Low on Mnday 27th open
THEN
Next high an turn on 30th
Jay
i see the dollar reversing on monday, while you see the market bottom.
ReplyDeletewe'll see Jay...
sincerely,
cementzak
i tell you, that power graph you posted works for the DOLLAR, not for the spx. hope this helps.
ReplyDeletesincerely,
cementzak
Cementzak
ReplyDeleteYes I can see it as an ABC
BUT it also counts out as 5 waves
IF we DONT get a strong sell off today, then TOMRROW, even after open should offer a stronger selling day
some times we get a FLIP
WE GOT A STRONGLY lower open today
but the warning for getting worse just might be more proper for tomrrow
Using the First STRESS point
of SPT 27th AT 10am we are watching just HOW we get to the PIVOT
Im trying to PROVIDE a ROAD MAP, but all I can give really is the PIVOT or TURN points - How we get there is the mkts way of keeping us confused
____________
WOW Im busy today
______________
We got a 25 pts loss from 1148 to 1123
NOW back up 50% to 1135
62% would be at 1139, but I tend to doubt they will get there
Also
I can SEE abc x abc from the low of 1123 to 1135
ARe we on the same page?
ALSO
If the mkt is setting UP wave A and B TODAY, then wave C is TOmrrow, which can break into 5 waves
If the mkt is setting up wave 1 & 2 today , then WAVE 3 is tomrrow
Tomorrow is more influenced by the Hard neg energy of Saturday
& Sunday with the overflow on Monday OPEN.
Jay
I agree with Cementzak. Ff we don't close below the open of today, we likely go to higher highs into Monday. This setup is similar to 7/30, 8/16, and 8/31 of this year. We do need to start selling off here..but the NASDAQ has certainly led this rally and looks like up is the direction. That can all change by the EOD today, but if it closed right here, we should get an up open tomorrow. Just what I see.
ReplyDeletethanks guys
ReplyDeleteFYI
Im attempting to look ahead
using the scientific resources available to me as published for
the members & guests
Jay
Yes
ReplyDeletethe daily reading may have flipped
we had the LOWER open today and thus tomrrow might open higher
and fail afterward
Whenever I find a reading that states
DONT believe what you hear , read or see, it LEADS TO A TURN
thus it confirms my suspicion about a lower OPEN on Monday and TURN at 10am
Thus If we dont get a serious sell off today, then IT MUST HIT TOMRROW
Jay
I agree with what cemenztek is seeing - one more high before we pullback ....
ReplyDeleteTake a look at this ...
ReplyDeletehttp://2.bp.blogspot.com/_-p17nqJfPI8/TJtf4iiWPxI/AAAAAAAACKk/NaifcGmBP-k/s1600/spx+60.png
I must say Jay, good call. The intraday chart looked like consolidate and break upwards...
ReplyDelete