I know it sounds LIKE I'm crying WOLF too often and always seem to be bearish,
but this SLOW GRIND UP from the JUNE4th LOW has performed all that is necessary to COMPLETE the WAVE structure of a second wave rebound-
YES we thought it was DONE last week, but the double low at 1397 on the 4th told us otherwise, and we got the 5th wave THRUST on wave C -(2) of P3 to 1437 so far at noon.
What does all that mean, You ask.?? good question-
The anwsers lie in the 2 graphs below -
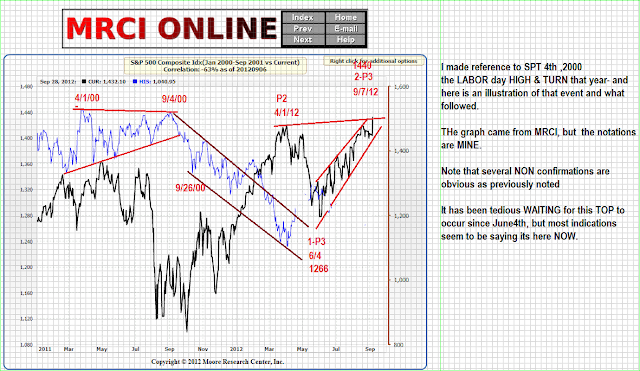
One from Y2K comparing to 2012 , and the other showing and labeling the CURRENT WAVE from the JUNE4th low @ 1266 and the CURRENT high at 1437.
I had really expected a pivot low at 1388 to occur this week PRIOR to the run up to 1440'sh on about the 14th, but SINCE we have have already achieved those goals, we MUST LOOK FORWARD AND PROJECT what is MOST LIKELY to occur NEXT.
The above graph is from stock charts.com public pages
The above graph is from MRCI, but the chart lines & NOTATIONS are MINE
TODAYS READING SAYS
DONT FOLLOW THE CROWD AND DONT BELIEVE the
HYPE you hear from the MAINSTREAM MEDIA
ALSO
BE cautious not to be OVER EXUBERANT
and watch out for MISGUIDED OPTIMISM
Almost forgot
ARMS index data has issued a SELL SIGNAL
which I expect to be reinforced today.
STAY TUNED FOR FURTHER UPDATES
Jay


No comments:
Post a Comment