THE NEW JAYWIZ 2023
THE NEW JAYWIZ 2023
Tuesday, August 03, 2010
August 3rd EKG
39hrs at 10am
78.6% /13 day at 12:25
90b@ 10;30
126b@ 1:30
156B @ 4pm
Those who are waiting for the typical fall declines in October are probably going to be sadly disappointed. The PROBLEM time appears to be from NOW till Oct 4th, as Ive mentioned several times and given data in reference to that date.
more later
Jay
Monday, August 02, 2010
August 2nd EKG
Futures this morning confirm an UP open
Energy highs are possible at
10:30am
and
1;38pm
Cant tell if the day will close off the highs, but it does seem likely
The daily read calls for smooth sailing & advancements
30bars @ noon
&
60bars is due @ 2:30pm
more later
Jay
Energy highs are possible at
10:30am
and
1;38pm
Cant tell if the day will close off the highs, but it does seem likely
The daily read calls for smooth sailing & advancements
30bars @ noon
&
60bars is due @ 2:30pm
more later
Jay
Sunday, August 01, 2010
Elliott wave Graph from Columbia
from Columbia's public blog
looks like W3 might be dead ahead, or at least 1 of 3 of P3
~~
And My Aug energy graph also shows a very dangerous time period from the
17th to the 24th, a full moon with a bad temper this time.
Aug 11th is 360 tr days from March 9th as an important cycle ,
BUT THEN add 17 more days for that MAGIC 377 of Stan Harley fame, to get to Spt 7th, new moon day.
At the SAME time Mars & Venus make conjunctions with ARCTURUS- also know as the great
BEAR watcher
Power Graph, Week of August 6th
Ive mentioned this cycle previously
Jay
August 10th & 11th
360 tr days from March 6th & 9th, 2009 = 72wks or 1/2 of 144wks
275 tr days from July8th & 9th, 2009 = 55 weeks low to low
especially given that July26th was 55 wks from June 22nd ,2009 low to high
And the 11th is a Bradley date accompanied with a 39hr cycle pivot at 10am
Jay
Saturday, July 31, 2010
August 2010 Energy Graph
I realize you think I'm repeating myself and it sounds like the
little boy who cried wolf once to often
The PREVIOUS Energy discussion explained the similarities we are now experiencing to Aug, 2008 and the 34 trade days that followed dropping 3200 Dow pts
The Current configuration has been compared and found matching in many ways to Spt 6th, 1929
And others have a configuration similar to the 1930-1931 time period
there is also a configuration this month on the 21st that compares with the DUBAI effect
The JULY 30th & 31st configs can act as a trigger to demanding energy about to descend on
our economic structures
This weeks daily effects
Aug 2nd
expect distractions early
Take cover even if the day goes smoothly
Aug3rd
Difficult money matters
Aug4th
Conflicts
Aug 5th
Harsh start, but better after
Aug 6th
Happy, hopeful start
changes later and the caution flags are out
more later
Jay
weekend comments
they've got EVERYONE bullshit'd, which means BULLISH
PC ratios closed at 100% bearish
Jup 90 Pluto @ 4am on the 3rd has NO interference from mars 0 saturn - and we are well into the Lbra transit.
the NEG is enhanced by Mars 180 Jupiter and Mars 90 Pluto
Expect also a SMASH down OPEN or possible flash crash like open on the 4th
WHICH SHOULD RECOVER after the open
_____________
Bradley date is 11th which opens with 39 hrs at 10am
right On the 360 day cycle hit from March 9th & 275 tr days from July9th
______________
It looks like we should expect some very dramatic drops between now and the 11th
_____________
I have NO idea how to label Elliott waves to this point or to
the 10th and Oct4th/7th for that matter, but I really think it will end up counting as a LARGE ABC or 4th wave retreat within P2, OR
possibly will count as wave 1 in P3.
in either case we might expect a 38% to 50% retrace
of the gains since March 9 lows
666-1220= 555 pts
555 X 38%= 212 - 1220 =1008 , been there done that
which might have been the A wave of the above mentioned wave
or more likely
555 x 50% = 278 pts
1220 -278 = 942 which has been mentioned by others
more later
Jay
Friday, July 30, 2010
JULY 30th
Today
180bars hit at OPEN - MKT down 120 dow
26Hrs REBOUND High at 10am- dow off 23
now we see very clearly that the 39 hr cycle series can be rebound highs as well as HOD, or LOD
62%/13 day cycle is @ 11:13am
258bars @ 4pm plus negative energy influence after close
Jay
JUST a NOTE of WARNING since i wont be publishing the August graph till Sunday
MONDAY, Aug 2nd appears QUITE POSITIVE, but dont let it fool you,
as Aug3rd seems to be the EXACT opposite
Thursday, July 29, 2010
FOR THOSE who want to KNOW
ALL others for religious or other reasons can ignore, but LETS come back to this publication on
August 24th and Oct 4th to see just how well or not we did with this projection
In addition to Mars entering Libra, +Mars@ 180 Uranus, Today & tomrrow,
we also get Mars 0 Saturn offering STRESS & obstacles
______________
each planet and its placement has much to do with its NATURE & effect on HUMANS
at the time of such placement - where were the planets, sun, moon, stars, etc.?
how do they ineract with each other?
_______________
Heres an example of what I mean
During the SUMMER of 2008 the mkt was in a declining phase,
but when Mars entered Libra on Aug 20 it began to really pick up LEAD FEET.
15tr days later, the Dow had lost 800 pts on Spt 15 on a FULL MOON
34 tr days later the down hit its lows at 8450 on OCTOBER 10 @ a FULL MOON
This SEEMS TO BE the EXCEPTION as most FULL MOON's are like the
ENERGIZER BUNNY for the bulls - as we see the mkt runs higher into MOST FULL MOONS
____________________________
Also note that MANY- MANY Market LOWS occur in OCTOBER-
ITS A WELL KNOWN historic mkt event.
Oct 2002, 2007 - 2008, just to cite a few
____________________________
NOw back to present
Full moon on the Jly 25th found the mkt making highs
July 30th, tomrrow, Mars enters 0 degrees Libra,- mkt struggling to hold highs
---------
NEXT FULL MOON
is on Aug 24th accompanied by Saturn 90 Pluto on the 21st
now thats a SERIOUS combo representing Conflicts & Death-- ouch
__________
NEXT we END the series on OCT 4th - with the FullMoon on the 7th
with Mars in Scorpio / Libra sun & the accompaniment of multiple squares
It also marks STAn Harley's 377 tr day cycle low to low
More shortly
Jay
July 29th update
this chart for most of August has meaning for me also as you will see when i publish the August energy graph
Helge's chart shows a sell off today & tomrrow which was also shown on the JULY energy
Graph, altho we all know it did not start until the28th. There is some confusion as to NEXT weeks
LOW point as Helge seems to indicate the 9th, BUT energy points to the 10th, and CYCLES are
targeting the 11th.
I will be publishing the AUGUST energy graph this wkend
NOTE that IF we Do see a severe sell off tomrrow, JULY30th, then as Helge shows, Monday could offer a brief reprieve for the day as I will also picture it.
Jay
Its NOT a matter of IF, but simply WHEN
and that WHEN is very close by
Jay
I'm away and only have limited access, so there have been no updates
258 bars hit on Tues @ 2pm
90 b Hit @ 3pm Wed
126b is due at about 11am today and the mkt is still falling afterward
55%/13 day @ 11;59
180bars TODAY is due at 4pm along with some neg energy at 3:45pm
__________________
Tomrrow - friday
Neg energy at 7am & 9:31
26 hrs at 10am
62%/13 day at 11;13
258 bars at 4pm
Neg energy should overshadow the mkt allday.
more later
Jay
Wednesday, July 28, 2010
July 28th
Expect another 10am high today & it might even stretch to 11am
but the atmosphere should change later today,
as it is possible the highs of the latest ABC rebound OFF the July 2nd LOW at 1010 may have finished
Tuesday at 10am at spx 1121
Jay
but the atmosphere should change later today,
as it is possible the highs of the latest ABC rebound OFF the July 2nd LOW at 1010 may have finished
Tuesday at 10am at spx 1121
Jay
Tuesday, July 27, 2010
Start new thread July 27th
Watch 10 am for a high today
Wed is 55 tr days May6th and could offer an important turn
Jay
Wed is 55 tr days May6th and could offer an important turn
Jay
Sunday, July 25, 2010
POWER Graph week of JULY 30th
more later
Jay
Jay
The second graph was published on August 1st to rectify my errors from publishing the original
the original was published a week in advance and was skewed based on other factors
I will try NOT to let those other factors influence my judgment in the future
Jay
Friday, July 23, 2010
JULY 23rd EKG
Thursday, July 22, 2010
JULY 22nd EKG
As promised the 26 hour cycle appears @ 10am and should be the HOD
Jay
NOT exactly what WE were expecting FOR THE Whole DAY but we were warned about a STRONG GAP OPEN.
Note the OBV is showing LESS strength near the end of the day as the dow made slightly higher highs at 3;30pm, but on increasingly WEAKER internal strength
Also note the PC ratios which were 66% bullish on WED close are now 80% bearish tonight
Jay
Jay
NOT exactly what WE were expecting FOR THE Whole DAY but we were warned about a STRONG GAP OPEN.
Note the OBV is showing LESS strength near the end of the day as the dow made slightly higher highs at 3;30pm, but on increasingly WEAKER internal strength
Also note the PC ratios which were 66% bullish on WED close are now 80% bearish tonight
Jay
Wednesday, July 21, 2010
JULY 21st EKG
AND SO we HAVE another PERFECT HIt which CONURED with the POWER data graph |
Today's EKG does seem to CONCUR with the updated POWER GRAPH
156bars today at 10am low seems to be heading there after a higher open
Monday JULY 26th is 275 tr days ( 55 weeks) from a previous
low on JUNE 22nd, 2009
PLUS ~ there is a HEAVY negative energy effect on the 26th @ 1pm
BUT even MORE important is August 10th which is ALSO a 55 week cycle/ 275 tr days
from JULY8th, 2009
JULY 21st UPDATED POWER GRAPH
Yesterdays LOWER open FIT in QUITE WELL with DATA &
PROJECTIONS PRESENTED In advance on SUNDAY JULY 18th.
RALLY TODAY SHOULD RUN OUT OF GAS about mid day or sooner
Tomrrow's 26 HR cycle at 10am should offer another HOD
& trade in reverse of Tuesday
more later
SCROLL down to previous main page from SUNDAY to get DAILY cycles & readings
Jay
Tuesday, July 20, 2010
CYCLE update
important cycle lows appear as follows.
LOW DUE on July 20 = 260 tr days, or 377 cd from July8, 2009
EXPECT rebound on 21st & 22nd till about 2;30
LOW due on JULY26th = 275 tr days from JUNE 22, 2009 ,
a cycle low
EXPECT HUGe rebound on 27 & 28 till about 11am
Selling picks up again LATE on July 28th and ends on 30th at or near close
First week of August looks MIXED
Up on 2nd
down on3rd
Up till Midday on 6th
then low as CYCLE pivot low ends on Aug10th @ 360 tr days from March 6th
JULY 20th EKG
to answer your question & observation YES
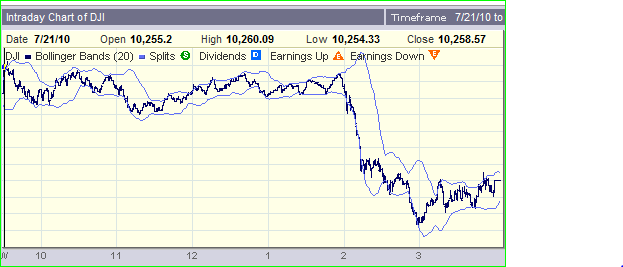
but this NEW graph above is from another source which also shows
an ALMOST near duplicate of yesterday's EKG
EXPECT today to END at or near 4pm at LOWS
Some one suggested spx 1030 to 1045, and It would seem right given a rebound due the next day which also concurs with the reading that calls for a marked improvment over night TONIGHT
Jay
Friday's PC ratios were 80% bullish
Monday's PC ratios were 90% BEARISH
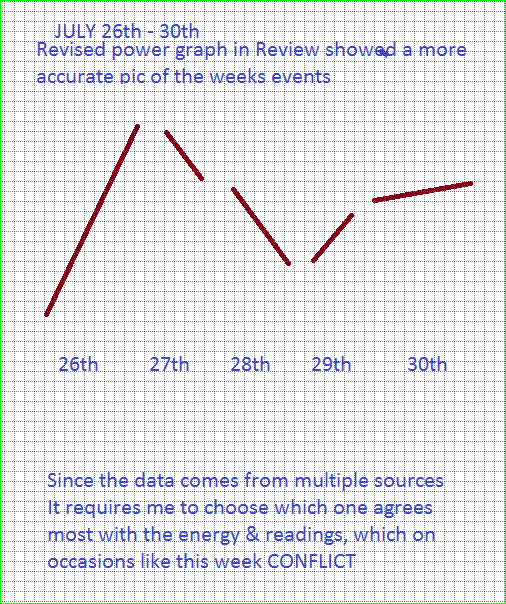
Power data comes from multiple sources and It requires some additional structuring
on my part, which I skew based on energy, cycles etc, so occasionally,
I WILL get such a mix up
Whats that mean for today?
Good question since we DID get an extension of the LATE selling from Monday
then we need to ask, was the low at 9:45 to be considered the LOD?
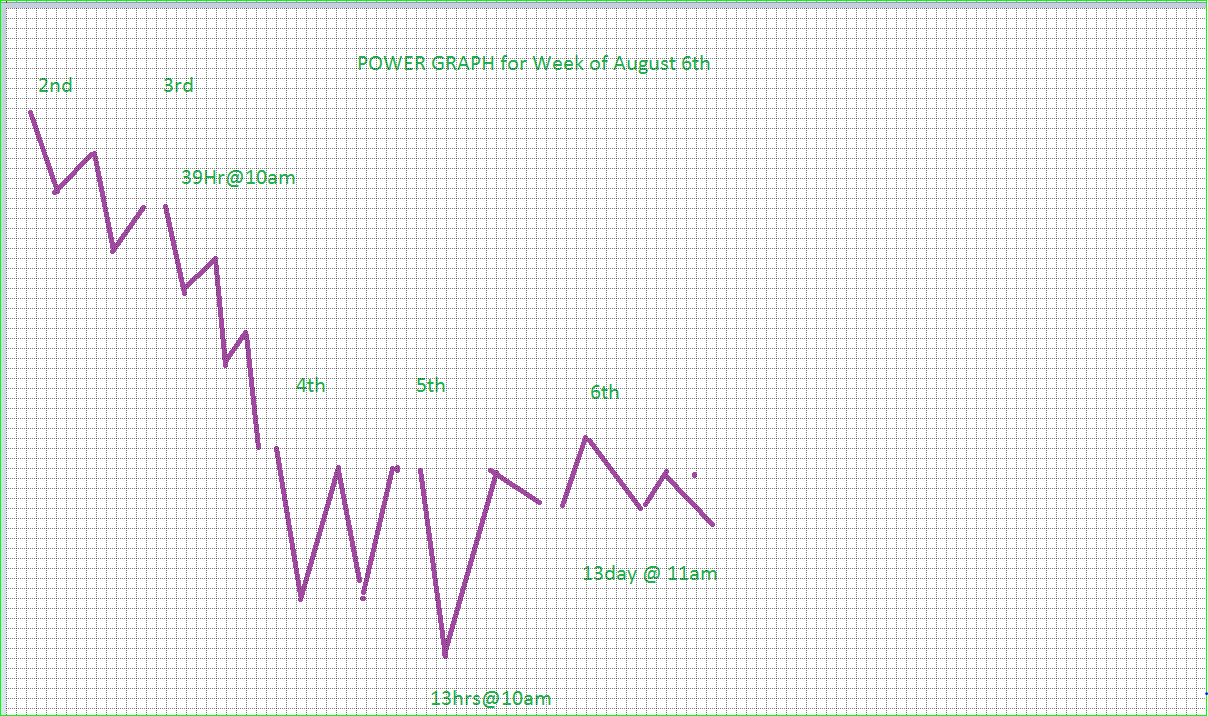
OR does the 39 HOUR cycle offer a REBOUND HIGH off the open low
at 10:30 to 11am.
Enter other cycles
13 day at 11am can be extended
same goes for 90bars @ 11am
we'll see in about 10 minutes
bars today
90b @ 11am
120b @ 1:30pm
150b@ 4pm
IF 4pm DOES PROVIDE the LOD today, then EXPECT the MKT to EXPLODE higher
tomrrow and higher still on OPEN on Thsday = 26 hrs cycle at 10am
One thing the POWER graph does seem to confirm, but not published yet, is a 55 week
275 tr days LOW on the 26th as well as a 4 tr day cycle all at 4pm
NOTE: Charts Edge this week agrees with my outlook, especially if we flip Mon & Tues
more later
Jay
Monday, July 19, 2010
JULY 19th EKG
Subscribe to:
Posts (Atom)