THE NEW JAYWIZ 2023

THE NEW JAYWIZ 2023
THE NEW JAYWIZ 2023

Friday, August 31, 2012

Market Timing-Whats Next !! -- POWER DATA & EKG=80% Correlation IN ADVANCE

CHECK THIS OUT FOR YOUR SELF  --- 80% correlation to the SPX

WATCH THIS
POWER DATA published on 8/27 for the VPN group- SEE just how ACCURATELY it forecast the FLOW OF PRICE ACTION ON THE SPX--


AND IT WAS SENT OUT TO THE VPN MEMBERSHIP 
-ONE WEEK IN ADVANCE - on AUG 27th  - note the date & time on the EMAIL 


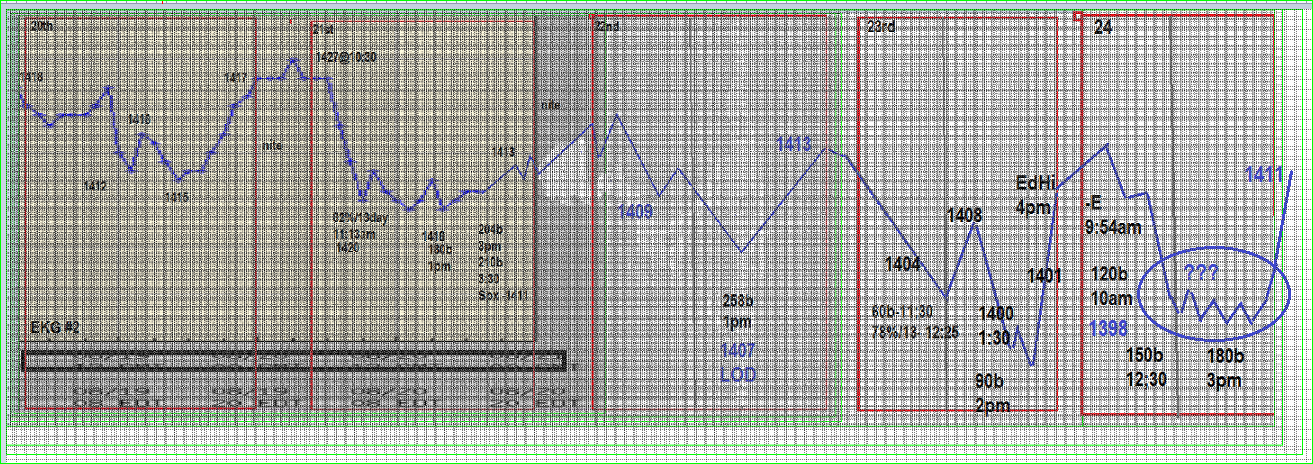
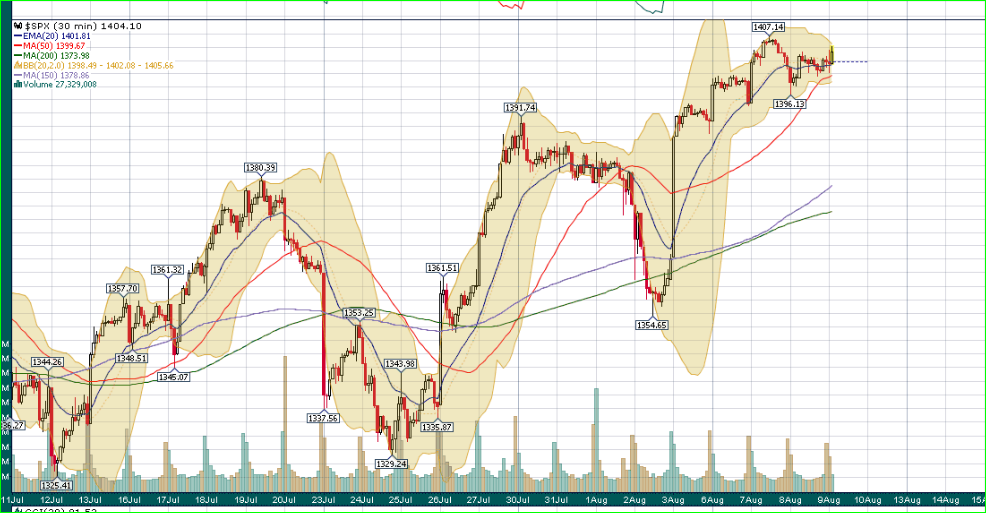
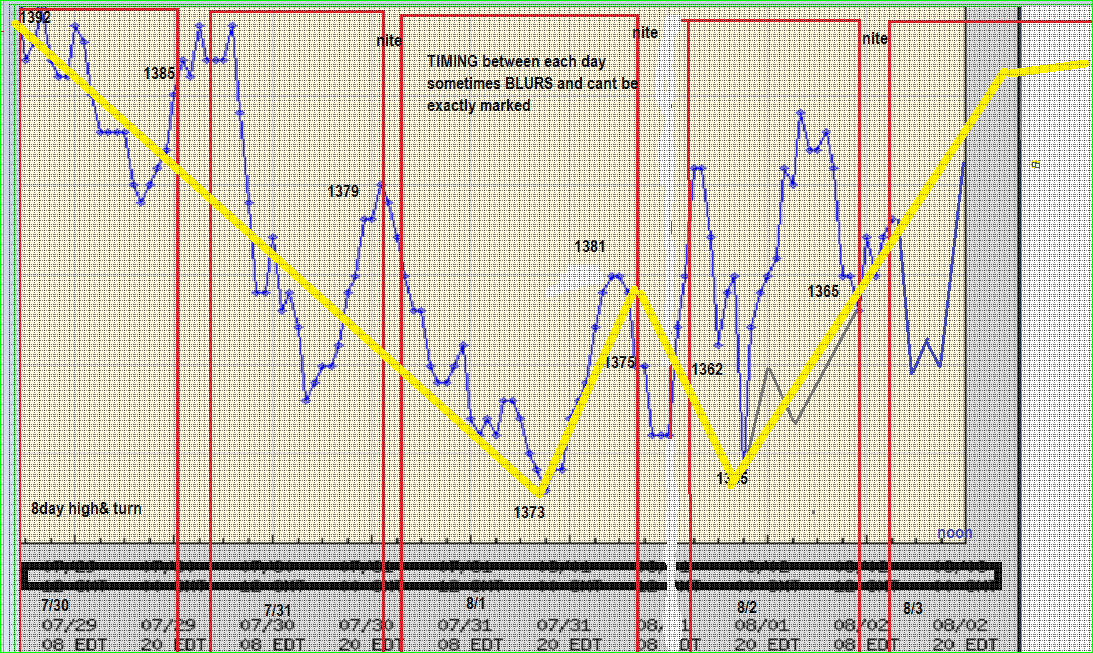
 THE POWER DATA GRAPH below depicts in YELLOW depicts the SPX,
 ONE Week in advance

The RED line shows what actually occurred - except for today since the email was sent out at 9AM. BUT YOU CAN SEE for yourself, just how well it performed.
 

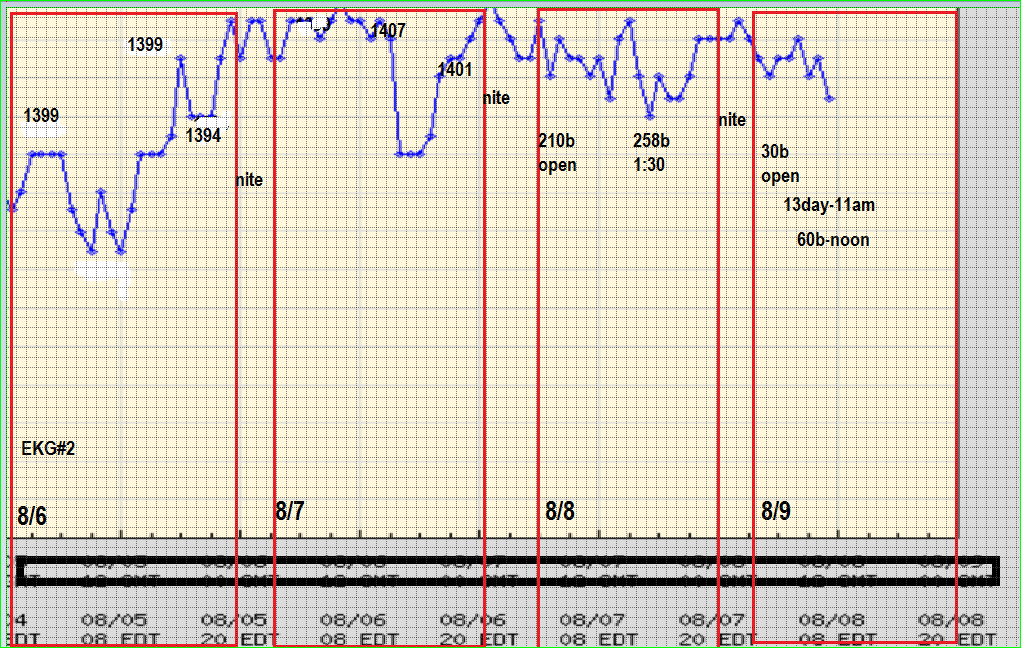
THE NEXT graph is the EKG for this week. Every day but Monday was near perfect
That's 4 out of 5 days which of course equals 80%


SO< what are you waiting for? 
STAY TUNED FOR FURTHER UPDATES
and get a step ahead of the market
Jay


Thursday, August 30, 2012

Market Timing- Whats Next !! more graphs

Is there any other timing service that keeps you in touch with multiple daily updates, especially when critical


Market Timing - Whats Next !! -- are we there yet ?

And if so, WHERE is THERE ?

Jaywiz told you & showed the internal tech data that indicated the mkt was overbot,but
to what extent??

 we showed you the vix making a new multi year low last week at the 13.30 level, and has popped up to 17.88, indicating all week that it was headed up- thus the MARKET DOWN

BUT WHEN ? It has been SOOO boring since Aug13th, that even those still on the floor must have been wishing they were on vacation also.

Is today's DOWN open to 1401, a signal of lower prices coming now, and if so then HOW LOW is low??

Typically, if this is an a-b-c correction off the 1427 high, then lets look at the math.
1427-1398= wave -a-  = 29 pts lost
1416 = wave -b-
wave -c- should then settle at 1416-29 to 1387
thats a 2% drop from 1416  - NOT MUCH in the overall scheme of things, but enuf to make a decent trade out of it.

ALSO, typically, the c wave should be rather sharp and decisive getting to the target rather quickly, which IMV, could be at open 2mrw and or close or both.

Heres a graph that shows the technical crack of support and other technical measurements

STAY TUNED FOR FURTHER UPDATES
and get a step ahead of the market
Jay


Wednesday, August 29, 2012

Market Timing-Whats Next !! Jaywiz DAILY EKG & SPX this week

I don't know how you can trade the market without the benefit of this marvelous resource.


 STAY TUNED AND GET AHEAD of the market
Jay

Monday, August 27, 2012

Market Timing -Whats Next !! Aiming for a target pivot low


A SIMPLE A-B-C

A = 1427 to 1398 == 29 pts
B = 1416-- HIT MY TARGET estimated time was 10:15, actual time was 11;30
C = 1416 - 29 =  1387

Jay

Market Timing-Whats Next !1 - last week's intraday timing

NOTE that the DATA summary for the WEEK of August 24th was sent out to VPN members
on AUGUST 18th.
STAY TUNED & GET AHEAD of the Market
Jay


Saturday, August 25, 2012

Market Timing -Whats Next- POWER DATA last 10days


THE POWER DATA GIVES US A VIEW OF THE WEEK AHEAD
NO, ITS NOT 100% perfect, but it does show us the DIRECTIONAL movement for the SPX, etc.

Market Timing-Whats Next !! NEXT WEEK Choppy

SO what else is new? Choppy tells us nothing !!
we are expecting a LOW on the 28th and or open on the 29th, with a rally into Friday to end the month on a positive note -- HOW HIGH ? you ask. good question

Any new highs over 1427 are possible but not guaranteed on Spt 14th and/ or 21st

What we seem to be experiencing is a typical August-Labor day high , WILD September, and horrible October

Other than Friday, the EKG COMPARED QUITE WELL for each day -- Remember that it is sent out to VPN members the MORNING before, and updated during the day.
 BY the TIME we get the 7pm update, we do get a view of what we can expect the whole next day PLUS part of the day after thru about noon.

Heres the EKG  for last week and comparison to the SPX 
NO- ITS NOT 100 %, simply because Friday did not perform as well as we would have liked
thus we rate the week at 80%, since 4/5 = 80%

  ALSO NOTE THE DYNAMIC BELOW-- ITS DID show us a HIGH on the 21st, dropping into the
the 23rd and rebounding some on the 24th-- follow the GREEN LINE- IT ALSO PROJECTS NEXT DAY ACTIVITY as well as the EKG


NOW, we look at the ACTIVITY graph below which also agrees with the Dynamic, thus giving us a wonderful view ONE DAY AHEAD of the actual market action-- NO ONE of these SCIENTIFIC RESOURCES can STAND ALONE, but when we COMBINE them, we do get a SOLID VIEW of what to expect the NEXT DAY


SO, it really comes down to getting ALL the ABOVE the DAY PRIOR at 7pm,
UPDATED at 8AM, the day of, and
UPDATED at 4pm and / or again at 7Pm

What you are getting for $100/90 days is a tremendous convergence of data DAILY, which is FAR GREATER than any other SERVICE -which most update once a day and many only weekly

Stay Tuned for further updates
Better Yet- DONT MISS OUT ANY LONGER - JOIN THE JAYWIZ VPN

and find out what to expect for ALL OF NEXT WEEK, NOW-TODAY Jay


Thursday, August 23, 2012

Market Timing- Whats Next - REVIEW the WEEK

PLUS 2mrw's EKG, IMPACT & DYNAMIC index graphs

ITS JUST LIKE a WELL Rehearsed orchestral symphony

stay tuned for further updates

get ahead of the market -- JOIN THE JAYWIZ VPN 


Tuesday, August 21, 2012

Market Timing- Whats Next !! NO MORE WARNINGS

Have you seen the VIX??
Is this something to alert traders to whats next??
Have you seen the Euro dragging lower while the SPX makes new higher gains?

What is TODAY?? 
Its 55 trade days from the June4th low, a typical FIBO convergence , low to high.
BIG changes are due shortly, this week which will possibly create international turmoil, 
or at least the threat of it thus changing buying or selling perceptions.

the NEXT 55 day convergence is Aug27th, exactly where Ive indicated the next low, with the 28th as a pivot higher to the eom.  Ohhh !! I forgot, it was not noted here until now- Only the VPN members have the entire progression thru October.

On the SPX, we can note a COMPLICATED multi wave uptrend from that June 4th low at 1266 to 1427 today.   
Some numerical coincidences to note
Dow had a 333 in its price high today--=  triple 3's add to 9, an ENDING #
SPX at 1427 adds up to 5, representing CHANGE
Today is an 8day HIGH /TURN, making 2mrw an acceleration

1408 has been noted by some techs as critical support, and if that breaks, then 1395 is next
as I type this the SPX has fallen from 1427 at 10:30am to 1411 at 3:15pm.

CNBC reporting that Israel is planning to prevent Iran from continuing to develop an Atomic weapon. That has been going on under neath the surface for a while now, but somehow, its coming out in the MAJOR NEWS Media today, with a little more urgency than previously noted.

MY work with INTERNAL TECH DATA & ARMS index levels has NOT changed other than to got MORE OVERBOUGHT, and has been building to a great degree since August 13th, thus building more reason to be CAUTIOUS.

YES, IVE BEEN WARNING about a CHANGE since Aug13th-- MAYBE you got a good laugh from my reports as WAVE 2 continues to build higher. ITS MAIN PURPOSE is to KEEP the GENERAL public thinking BULLISH, and even today as the SPX reached 1427, the DOW was closing in a new annual HIGH
near 13,500. THE MEDIA was interviewing ONLY those people who are professing SPX to 1500 by year end, THUS IMV, GIVING TRADERS MORE REASON to WAKE UP.

IS THIS FANTASY ??
And if so when is REALITY going to appear?? -- DUHHH, ITS creeping up on you slowly,
Thus YOU HOLD ONTO YOUR POSITIONS  still expecting higher prices-- 
EVER HEAR of the SLOPE OF HOPE  - DONT LET yourself get trapped that way.


STAY TUNED FOR FURTHER UPDATES
Jay


Saturday, August 18, 2012

Market Timing-Whats Next !! Time & Price Collide

below is an email that was sent out to VPN members earlier this week.
Have I been BEARISH ?? yes
Is it warrnated -- Yes
Am I right to warn AHEAD OF THE TURN-- Yes
Is it better to be forewarned ? YES -
being forewarned is being forearmed -- READY FOR A CHANGE !!

Friday was 220 Days from the Oct4th Turn=  that is 55 FIBO x 4
Also 165 from Dec19th low pivot = 3 X 55
A marginal higher high over 1414 occurred on Aug17th
Representing either a failed fifth of P2, Or major wave 2 of P3
Internal tech data issued a solid SELL.
Arms 5 day = 87  -- under 100 = SELL
Trin 5 day = 435--- under 500 = SELL
Trin 10 day =795--- under 1000 = SELL
Arms 20 day = 89.5 --under 100 = SELL
open 10 trin = .80 -- under 90= MAJOR SELL
what most important about this data, is that the longer term indexes (10& 20day) are on a SELL
as well as the shorter ones - 5 day

Heres 2 graphs that point out the terminal effects of this weeks SPX, Dow Jones price peaks
Jay


Saturday, August 11, 2012

Market Timing-Whats Next !! COMPARE LAST WEEK

COMPARE THE PROJECTED EKG sent out each day at 8am the DAY PRIOR to trading

THEN updated at 4pm to see a partial of the next day after, and do forth,


THE FULL day of Aug10th was delivered to VPN members on the 9th at 8am

THE MAIN FACT IS, the MKT FELL AND RECOVERED by day's
 end EXACTLY AS SHOWN by the DAILY EKG.

& IT WAS KNOWN TO VPN MEMBERS the DAY PRIOR.

STAY AHEAD of the market -join the Jaywiz VPN

Keep in mind the EKG is a NATURAL phenomena.
Which means I don't make it up in the kitchen sink, 
thus I have no control over the way it depicts depth.

IT IS MANLY DESIGNED to SHOW intraday direction, and is used to complement other several scientific resources also sent out via email to each member daily to provide data that cannot be found anywhere else on the web. Data that gives the trader an edge with which they can make better trading decisions.

BEST WISHES
Jay


Thursday, August 09, 2012

Market Timing-Whats Next !! - AN INTERNAL SELL SIGNAL

MARKET INTERNALS  JUST TRIGGERED a SELL SIGNAL

          Aug7th                                 Aug8th                              Aug 9th

Market Timing - Whats Next !! ENERGY LEADS stock prices

ENERGY WANING should have its effects on stock prices, but NOT TILL NEXT WEEK

Moderately higher prices this week is not supported by the internal combustion energy that drives humans to behave in certain ways, Thus once the FUEL runs out, we will see the outcome of that depletion.

SUCH a decline of strong proportions is NOW DUE starting late on Aug 13 to the 15/16th

Jay

 THE SPX graph is shown below to accentuate the differences, not the confluences
RUNNING LOW ON FUEL = a sharp decline next week.


Wednesday, August 08, 2012

Market Timing- Whats Next -!! NEG CYCLE NEAR

NO 300 point drop- NOT YET, but the NEGATIVE DOWN CYCLE is NOT FAR OFF

THERE is potential for the SPX to MOUNT over 1400 ONE MORE TIME -MAX 1414

OVER the NEXT 3 days leading to a ROLL OVER ON AUG13th, about mid day

Until then the EKG, DYN, IMPACT, etc are in STALEMATE , between 1380 & 1414

NEG Energy effects on the 13th to 15th will outline the course of direction for the balance of August.

VPN members know exactly what to expect

STAY TUNED FOR FURTHER UPDATES
Jay


Monday, August 06, 2012

Market Timing- Whats Next - 300 POINT Down DAY

IS WAY OVERDUE and 2MRW looks like we get one of those such days

IS that the BEGINNING of a CRASH  ?? -- NOOO !!- sorry

it just opens another OPPORTUNITY for one more attempt to break over 1400 and stay there.

YOU MEAN THE SPX will get to 1400 and STAY ABOVE THERE??  
NOOO!!   ATTEMPT ONLY

SORRY !!
ROLLING HIGHS / TOPS seem to take forever to ROLL OVER, and this one seems to be 
NO EXCEPTION 

STRONG RESISTANCE at 1404 and STRONG SUPPORT between 1370 to 1355, FOR now and maybe till the end of August.

A mid day LOW today is due at about 1pm
SEE the EKG for today's  TIMING notes

Mercury, the planet of COMMUNICATIONS is about to turn direct , IT has been in RETROGRADE since JULY15th & has a way of making what we THINK & write seem fuzzy - thus CLOUDING/ blocking our judgement & clarity of thought.

NOW WE CAN OFFER GREATER CLARITY of projections also as the cloud lifts
REMEMBER this tune -

I CAN SEE CLEARLY NOW, the CLOUDS ARE GONE---

VETERAN VPN members DO NOT USE THE EKG FOR DEPTH

 My INSTRUCTIONS right FROM your sign up will identify what & HOW to USE the EKG

NO, ITS NOT PERFECT -- BUT DOES a DARN GOOD JOB of capturing the flavor of the day

COMBINED WITH
IMPACT
DYNAMIC
ACTIVITY
FLUX
ELLIOTT
CYCLES
CHARTING
FIBO
and more, we get a very good picture of what to expect next

also, many of my members are technical analysts on their own and share their views as well

We also SCOUR the WEB for CURRENT data, graphs, & charts to assimilate and summarize
to determine what is most likely to occur next

In other words, JAYWIZ does NOT work alone in a vacuum with just his little piece of the pie.

WE draw on MANY sources & combine with the above to get an analysis

STAY TUNED for further updates
and of course, JOIN the JAYWIZ VPN & get ahead of the market.

Jay