THE NEW JAYWIZ 2023

THE NEW JAYWIZ 2023
THE NEW JAYWIZ 2023

Friday, April 29, 2011

Market Timing-Whats Next -April 29th- expanding triangle


STILL looks like we could see this wave unfold in May 2011
Jay

Market Timing-Whats Next -April 29th- Morning Report -Additional Data


ABOVE is
VIX at NEW LOW - WAVE 5 ?
BKX, banking index NOT keeping pace with major averages ?
McLellan osc under 10, not showing strength to sustain further gains ??

What does the above tell us??

Jay

Market Timing-Whats Next -April 29th- Morning Report


April 29th @ 8:30am
the above looks some what very different than yesterday

SPX hit 1361.52 & believe it or not, adds up to a NINE
Dow hit 12,771=  9        DITTO

SENTIMENT VERY POSITIVE
Jaywiz index = .35 mildly negative

Yesterday was an 8 day cycle which appears as an obvious high
thus making today an 8 day TURN- which way?? hmmm

FYI,
Monday is projected to open much like the 18th
there is a cycle convergence of 21-hour(258) bars & 13 days FULL cycle hitting at 11am
thus Monday May 2nd can duplicate April 18th,
but then we have to determine if thats another buy the dip day, or a sign of something other
Tues & Wed should tell us more.

More later
Jay

Thursday, April 28, 2011

Market Timing-Whats Next -April 28th- Closing Report


April 28th @ 8:55 am


ALL systems seem to be in SYNC
Impact stream shows potential rally right after open along with the EKG.
Power Data shows the day finishing better than is starts and the SAME goes for TOMRROW
we'll see if the EKG confirms that tomorrow AM

(I hope most of you can follow they way my indicators work)

Today we have
90 bars at 10am
120 bars at 12;30 or 126bars at 1pm
156bars at 3;30pm

the QUESTION for day trading today;
will there be enuf volatlity to trade today?
the ONLY Negative energy point is at  11am, which doesnt coincide with the bar pivots

So, we can see a lower open in the 5 minutes followed by a rally till maybe 9:45, then lower till 11am
HOW LOW?? sorry , CANT TELL
Is it worth trading ?? dont know, maybe if they can drop off by 100 dow points, but theres no way to tell.


more later
Jay

Wednesday, April 27, 2011

Market Timing-Whats Next -April 27th- MAY 2011 Daily Tendancy

CLICK graph to ENLARGE

Jay

Market Timing-Whats Next -April 27th- Closing Report

April 27th @ 9am

SPX 1350 & dow 12,600 still represents strong resistance
and the mkt will make a few attempts to break above to get to the FIBO level of 1373

The next level of NINE is at spx 1359 & 12,699
DOW has a lower level at 12,645 which is getting tested at 1pm, eight after the Fed announce
but SPX refusing to get over 1350 at the same time. 12,654 is also a NINE COUNT- just add the numbers to get to nine.  12,672, 12681, 126,90& 12,699

EKG today seems to agree with a low on the 13 day cycle at 12:25pm

And later rebound assisted by positive energy during and after Bens' press conference.

TOMRROW should set then back considerably all day

Friday's positive energy should allow stocks to RISE again, making what looks like a possible top
of the "D" wave of the expanding triangle as depicted on a previous page and out to the right on the main
page.


NOTE
Ive added the MONEY FLOW charts  from Market Insights
NOTICE that both charts show MONEY flowing into the market from the April 18th low,
BUT
the longer term graph shows it at a reduced level to prior highs.
Jay

Dow 12,707 = NINE, couldnt quite hold onto it.
SPX over 1350, but couldnt get to 1359.
OEX PC ratio FINALLY on a SELL
but
Jaywiz index on a BUY, but 2 days in a row gave a SELL @ .23 & 26
 Maybe get a higher open, great shorting OPP- or 25 pt rebound off a 50 pt down open.
Jay 

Tuesday, April 26, 2011

Market Timing-Whats Next -April 26th- UPDATE


WHEN WILL THE "D" wave END and start wave "E" ?

IMO< Maybe today and maybe Not till Monday , May 2nd.

WAVE "D"- WHY ?
PRICE = LIES
VOLUME = TRUTH
We have new current rally highs on LESS AND LESS VOLUME

May2011 opens the door again to UNCERTAINTY over the debt limits, but thats only the overriding
NOISE covering up the real reason for the decline as shown by the expanding triangle above.

NOW that the SPX has scored a new intraday high, nothing more need be done in terms of price.
Price breaks outs without VOLUME Support is doomed to FAIL.

Ben speaks at an auspicious moment in time, as the energy shifts from Neg to positive right after the Fed announcement at 12:30 as I mentioned b4 concerning the 13 day cycle.

Friday may end up as the actual high as there is substantial positive energy all day.

Energy & enthusiasm PEAKS this weekend, thus a serious let down begins in May,
but as You can see from the chart on TOP, its not the end of the world, as the WAVE predicts
that an agreement over the DEBT LIMIT might be delayed until the 27th-28th

spx @ 1350 = NINE when adding the numerals, which signals an ending in numerology
DOW 12,600 = DITTO, a NINE also, but 12,599 might be the number to look for or 12,601


More Later
Jay

Market Timing-Whats Next -April 26th- Closing Report

April 27 @ 9am, ADJUSTED EKG shows today's action much better than the pic below


9:25am- April 26th

It looks like the SPX futures want to record a 5th of 5th at open.

The other scientific data are showing a similar picture as the impact stream above

Jay

NOTE 4/27  comment
The DISCREPANCY of the 2 EKG graphs comes from the fact that the data comes to me from a STREAMING SOURCE, and its up to me to determine when it begins and ends, and of course, sometimes, I will inadvertently cut & paste incorrectly as the above 2 graphs clearly point out
Jay
 

Monday, April 25, 2011

Market Timing-Whats Next -April 25th- commentary, from B4 its NEWS

By MIKE WHITNEY ~ Counterpunch.com
 
Let's talk turkey. The dollar is getting hammered by the day. And the dollar is getting hammered by design, because the Fed wants a weaker currency to boost exports and lower the real burden of debt on the banks. (Yes, Martha, the banks are still insolvent) So, down goes the greenback, lower and lower, pushing up gas and food prices while the buying power of the average US worker vanishes down the plughole. And this process will continue for the foreseeable future because--as Obama stated earlier in the year--Washington is committed to "doubling exports in the next 5 years." Think about that: "the next 5 years". That's the same as saying that the American worker will be reduced to third-world poverty in a half decade or so. It's a death sentence.
And none of this has anything to do with lowering unemployment or raising GDP. In fact, the revisions of first quarter GDP reveal the lies behind the policy. The first announcement from the Commerce Department put GDP at 3.2%. Remember that? Now we've slipped to 1.4% and some predict the final revision could actually show negative growth. This is from the New York Times:
"Earlier this week we wrote that several prominent economic forecasters had lowered their estimates of gross domestic product growth in the first quarter of this year. Today saw even further declines. Macroeconomic Advisers, a forecasting firm, lowered its estimate to just 1.4 percent annualized, when just a few months ago they had pegged the number at 4.1 percent.
Capital Economics likewise brought its estimate down to 1 percent, writing in a client note:
Every data release last week seemed to necessitate a further downward revision to our first-quarter GDP growth forecast. By the end of the week when the dust had finally settled, that estimate was down to only 1% at an annualized pace. Indeed, there is now even a decent outside chance that the economy contracted outright." ("G.D.P. Estimates Slide Further", New York Times)
So, it's all baloney. The economy isn't growing. How could it be? Wages are flat, credit is still shrinking, (excluding student loans) and the only reason the unemployment numbers keep dropping is because more and more people are falling off the unemployment rolls. Everyone knows that. So, while there may be a slight uptick in consumption and retail; don't be fooled. It's just because it costs more to put food on the table or drive to work, not because people are scarfing up trinkets at the mall or living the highlife.
And the American people know what's going; they can see through this "green shoots" charade. That's why the latest survey from the New York Times showed that the "Nation's Mood (is) at the Lowest Level in Two Years" and that "Americans are more pessimistic about the nation's economic outlook and overall direction than they have been at any time since President Obama's first two months in office when the country was still officially ensnared in the Great Recession." ("Nation's Mood at Lowest Level in Two Years, Poll Shows, New York Times)
People have lost faith in Obama, the congress, and the political process itself. They can see that the system is broken and no longer responds to the will of the people, which is why they're throwing up their hands and giving up. It's obvious. Gallup found the same thing. Here's a clip from their recent poll:

Market Timing-Whats Next -April 25th- CLosing Report

EKG WAS PERFECT FOR DAILY DIRECTIONAL FORCES Today

Apr 25th @ 9:29am
Today doesnt call for anything significant

Just like april26th, 2010, my internal tech data did not issue a sell signal

Ray Merriman looking for TURN NOW
 
Tommrow has a greater chance of being much more important

Jay

Intersting footnote
today's low at 11:13 was the EXACT second for 61.8% of the 13 day cycle
Wednesdays 13 day segment is 78.6% at 12:25, just 5 minutes prior to the FED announcement
that Tells me to look for a LOW at, and rebound after 12:25pm

If they are really going to keep a date with 1220 within the "a" wave, possibly on May3rd,and or 4th
then tomorrow has got to show it's true colors, or it ain't gonna happen that way.

Tomrrows outlook says that emotions will rule over $$
expect an unfriendly day & no agreements

Jay

Sunday, April 24, 2011

Market Timing-Whats Next -April 21st- weekend report - I CHING

Will STOCKS decline NOW

Market Timing-Whats Next -April 21st- weekend report

Another View from the NDX


Heres 2 charts of the NDX
lower chart shows the corrections of the last 7 years,
according to this graph, we are set for the next one, NOW

Jay

Saturday, April 23, 2011

Market Timing-Whats Next -April 21st- weekend report


Ive re labeled some of Columbia's Elliott waves to show a possible "B" wave TOP occurring
as ive projected on August 17th, 2011, thus leaving the door open for the INFAMOUS "C" wave to take place between Aug17,2011 and June 2012, or at least most of it. IF we remember Oct 2002 lows were also followed up in March 2003 by a secondary low, and we should probably expect about the same in the coming wave.

Using FIBO once again, we can project a possible high at 1373
900 pts lost in 2008 -2009
900 x 78.6% =707
707 + 666 = 1373
Since the current leg exceeded 62,8% retrace at 1225, shouldn't we expect the spx to seek the next higher fibo level at 1373?
1340 represents 75% retrace

Jay

Market Timing-Whats Next -April 21st- weekend report


IAN's LATEST comments on his blog state we are in for a BIG MOVE,
but He cant decide in which direction.

The above shows the latest SPX as a FAILED FIFTH, but the dow actually made a FIFTH
Fifth of WHAT ?
IMO, a 5th of a THIRD WAVE, BUT not a FINAL FIFTH OF FIVE
which as shown is due August 17th.

I have another chart that go back 7 years and show EACH correction,
WE are now over due for the next one,- its not my work, so I cant show it to you.

WHAT DOES THE MARKET HATE MOST??
******UNCERTAINTY*********
and the battle over raising the debt limit is 
STILL LOOMING LARGE. 

The LAST Correction April -May June of 2010 took out 210 pts from 1220 to 1010
percentage basis = 17 %
the flash crash came first from 1220 to 1065 =  155 pts =to 13%
IF
we get a similar reaction NOW thru May 27th, heres the math related to our current levels
1340 X 13% = 174 pts or = to spx 1166
1340 x 17% = 228 pts or = to spx 1112
this is only an attempt to get some perspective, so dont hold me to the exact numbers and or dates.

NOTE that each level above is near exactly 100 spx points above last years lows, not that it means anything at all.


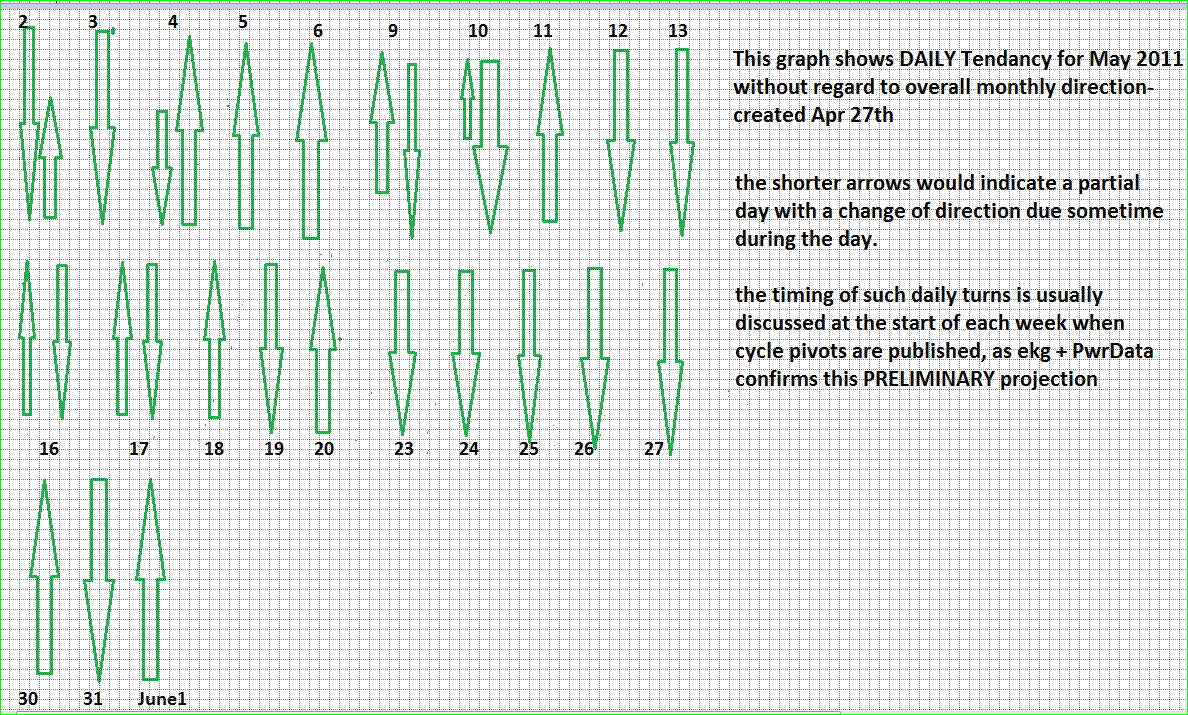
This graph as shown above gives us a view of DAILY DIRECTION rather than WEEKLY
as I was trying to depict in the past.

Commentary,
We have YET to feel any effects of the upcoming battle in Congress over entitlements such as Medicare,Soc Sec & Medicaid. WE all pay for these things out of  EACH PAYCHECK, so it really
is not an economic argument, but like Wisconsin, it becomes JUST A POLITICAL football.

Many other state legislatures are also attempting back door legislation to curtail unions, and create
economic hardships which would also curtail the Democratic party, since each union member would have greater out of pocket expenses, thus cutting down on the available money to contribute.

Happy Easter to everyone who celebrates
Jay

Thursday, April 21, 2011

Market Timing-Whats Next -April 21st- Closing Report

Today's EKG NOT a MATCH at all
Apr21 @ 9:20am


today calls for an enthusiastic morning giving out to a loss of confidence

Activity index at a low ebb at 66
dynamic index showing no strength
impact stream above also agrees

Jay

Wednesday, April 20, 2011

Market Timing-Whats Next -April 20th INTERNAL DATA


DOW JONES INTERNAL HEALTH as of April20th, 2011
current rally not making significant gains internally
Jay

market direction, whats next

EKG unavailable- having trouble with  firefox
Looks like they will open right at the upper line at 1330 area

Jay
OK, Got it fixed to some extent


Upper trend line right at 1330

Power data showed today as an upday with positive energy reinforcing, but it also shows possible late drop off and strong down day tomrrow

In a Triangle such as this one, they seem to be tracing out, time segments are quite symmetrical.
Feb 18  high to March 16 low = 17 tr days
Mar 16 to Apr 8 = 17 tr days, but Apr 6 was closing high = 15 days
Apr 6 hi to 18 hi to lo = 6 tr days
Apr  8 hi to Apr 20 hi today = 8 tr days
Apr 6 hi to Apr 28 = 15 tr days, expected to be a low
Apr 20 to Apr 29 could be high to high, but 27th is pegged as a low
Apr 6 Hi to May 2 = 17 tr days, new moon possible pivot low
Next high indicated at may 11th
last low indicated of the current triangle due at May27th

Jay

Tuesday, April 19, 2011

Market Timing-Whats Next -April 18th Where are we going ?

Contracting & Descending 4th wave Triangles are similar and lead to the same conclusion shown below


The Elliott graph at the top of the page depicts a Contracting triangle,
only because that Elliott site did not display a Desceding triangle as Ive DRAWN in the lower chart.
The original chart is from Columbia, and the Additions are MINE.

After the Completion of that 4th wave shon above we obviously get the FINAL 5th wave which continues the RUN from the March 9th ,2009 lows to my target top as of August 17th, 2011.

Using FIBO math, we can get some idea of where the highs will be.
900 pts were lost in 2008 & 2009
900 X 78.6% = 710 + 666 = 1376

Jay

Market Timing-Whats Next -April 19th Morning Report


Apr 19th @ 8:15am
GS earnings a BIG YAWN< same for J&J. but pushing the dow futures higher prior to open.

What does that say about the mkt right now?

another leg LOWER today, and or Wed AM to the 1280 area is DUE.

 The WAVE structure indicates yesterday was only part of Wv "a" of {C} which should take the spx back to the 1250-1260 level NEXT week after a bouncy bouncy WEd & part of Thsdy, which can give back most of any gains, but try try again on Monday.

Housing starts up 7%, but the mkt still yawning.

Those stats and earns only have a more positive effect when they are announced during an upleg
in the wave structure.

more later

Jay

Monday, April 18, 2011

Market Timing-Whats Next -April 18th Closing Report

April 18th @ 8:45am
60bars & 13 hours at 10am
90bars & neg energy during the noon hour- could be the lod
126b @ 3:30 also has a chance at lod

Just as PREDICTED, today should be down all day with
only a mild rebound from about 1pm to 2 pm

Tomorrow should rally in the AM, and settle back to close lower, thus setting up a BUY for
WEd and part of Thursday, which should sell off after 1pm.

9:10am UPDATE
S&P downgrade its US debt outlook to NEGATIVE, but still at AAA rating, due to the idea that Congress will not reach agreement till 2013, and there could be a downgrade from its AAA rating pending.
WOW, HOW DID I KNOW THAT SOMETHING BIG WOULD
HAPPEN TODAY.
JAY
Maybe that will get the attention of CONGRESS !!!!

Tomrrow's energy outlook indicates they will gain a NEW PERSPECTIVE which will lead to serious discussions about the debt, and a more constructive attitude by both parties.
Just like LEHMAN BK on SPT 15th, 2008, this DOWNGRADE boosts FEAR, and should get CONGRESS to Take action.
Jay 

SEE the Columbia chart at the top of the page- IT LOOKS LIKE SPX 1280-1284 should be the low today. J

Helges Intraday charts for this week had the exact direction today, and has tomrrow DOWN ALL DAY. Tomrrow is the actual 890 tr day cycle, so it could happen. The Wave count today looks like 1 thru 4, and may have started wve 5 at 3;30.
thereby skipping over the 126bar cycle, but all the others earlier.

tomrrow
the next bar pivot is at 11;30
38%/13 day cycle is at 10:42
Neg energy at 11am
could be the lod, or if Helge is right could make it to eod
EKG shows lower open.
Jay
STILL GOT WED for an UPDAY into Thsday AM, then turning down

Sunday, April 17, 2011

Market Timing-Whats Next -April 17th - Daily Tendancy thru 29th

April17th at 11am

This graph shows HOW that ELLIOTT wave from the previous page should develop over the next
7 to 10 days. IF we can possibly expect a low under 1250, then Monday's decline should be quite substantial, and it most likely will be, but not in a proportion to get under 1250 by the 26th/27th.


Jay

Market Timing-Whats Next -April 17th - Elliott wave formation

The above wave formation will depend on where "C" closes, above 1250 is indicated, which differs from wave charts below

C should form on Monday and or April26-27th
this formation allows C to hit lows at or near March 16th @ 1250

Another formation of this wave structure would allow "C" to end below March 16th @ 1250

BUT this one does not allow the "B" wave to reach almost as high as the original top at 1344
and since we did get to 1339, that would suggest the first chart above
 
We should get a good idea of the markets intended destination level on Monday

Jay

Market Timing-Whats Next -April 17th - Money Flow

DOES THAT SPEAK VOLUMES or WHAT ?
Jay

Saturday, April 16, 2011

Market Timing-Whats Next -April 16th - Elliott Wave Projection

Hooray- I found an image hosting site and thus I can add my own Elliott wave labeling

After this decline, end of which can possibly extend to mid May we can still expect the market to rebound into June , July and up till August 17th where a top of the entire trend from March 9th, 2009
can possibly be in effect, leading to a 1year steady decline into May or June of 2012 where the Kondratieff Winter LONG WAVE seems to make its lows. From there, we can expect the markets to
STRUGGLE higher into for the next 13 months as it begins a new 70 year cycle. Similar to 2002 and 2003, as well as 1991-92, 1980-82, etc, we can expect a secondary low sometime in 2013.
Jay

Market Timing-Whats Next - Daily Directional Tendency next 10days

Published April 16th @ noon

Friday, April 15, 2011

Market Timing-Whats Next -April 15th - Helge AND VIX charts

VIX NOW LOWER @15:12 than April 26th at 16.13

BOTH charts point toward April25th as the NEXT LOW
Consider that the last dip showed a low on April11th,, but it occurred on the 12th.
thus we might look for a low on April26th, and possibly part of the 27th
Jay


ITS NOW 12:30 and it looks like FIBO will not be denied
Minor positive energy high at 2:3opm might offer the hod today
1321 to 1325 still looks like a target price level
already got 1322 a few minutes ago
 
NOTE that BOTH Helge Charts show a HIGH right about NOW, today
matching the Elliott Wv 2 rebound off 1303 wave 1 low


MONDAY starts with 60bars & 13 hours at 10am
serious negative energy at 12;03pm 
another neg at 1:35 pm
126bars @ 3;30

WE ALSO HAVE a TECHNICAL SELL SIGNAL Issued by the ARMS data
5day arms = 86.6 --under 100.0 = a SELL
5 day trin = 4.33-  under 4.00 is considered a sell- its a close call
10day trin = 989 - under 1000 is a SELL
J