THE NEW JAYWIZ 2023

THE NEW JAYWIZ 2023
THE NEW JAYWIZ 2023

Tuesday, August 31, 2010

87% correlation


Its now or never
Jay

August 31st EKG

OK, But papa wants MORE
Jay
Futures indicate a LOWER open

13 hr cycle indicates a quick rebound off the open

10am/13 hr cycle indicates a SEVERE downturn
given consumer & investor confidence data

Hurricane's Earl & Fiona are heading our way- East Coast

As I PREVIOUSLY mentioned- Spx 1040 has to be broken today,
and it certainly looks like it will be CHALLENGED this AM

Once gone, the next target of course is 1010

this is NOT cut in stone, but would be expected if Your a student of Elliott waves
to reiterate
1220-1040 =180 pts lost in wave {A}
rebound to 1130 in wave {B} = 90 pts
WAVE equality would suggest Wv {C} = 180 pts
1130 - 180 =950

we have a convergence of cycle PIVOTS hitting Spt 3rd
377 tr days from March 9th, 2009
144 tr days from Feb 8th, 2010
464 tr days Oct 27th, 2008 - which is an 8 day repeating segmented cycle

more later
Jay

Monday, August 30, 2010

Pwer Graph this week


Jay

August 30 EKG

Today calls for a SLOW START
early confusion
dreamy till mid day
fruitful conclusion


30bars at 11am
60bars at 1:30
90bars at 4pm

23.6% /13 day at 11;30
should set the tone for a stronger afternoon

Jay

Hurricane Earl is on target to only skirt the eastern edge of the US coast line
but not make landfall

Saturday, August 28, 2010

WEEKEND thoughts


LATE Monday should provide the high we are looking for at the 1080 area-
If it comes in the first hour, then Im off to play golf the rest of the day

Monday is an 8 day HIGH, making Tuesday an 8 day TURN, fitting PERFECTLY
into my previous scenario at the 10am/ 13 hr hod.

HERE'S THE RUB
IF we are going to see a drop under spx 1010 next week, IT HAS Got prove itself
on Tuesday by taking out the 1040 support AT A MINIMUM, other wise the "C" wave
will be very ANEMIC , and NOT make it to 950 or less

The Chart above CAN BE very deceiving -
making bulls think that 1040 was MAJOR SUPPORT

However,Typically we get WAVE equality of wave "A" & wave "C"
wave "A" from 1220 to 1040 was 180pts
which means that wave "C" Should be the same.

Monday at 1080 - 180 by weeks end =900
And if a daily decline, can also be viewed as a CLIMAX wave,
setting up the next impulse wave into at least mid NOV.

more later
Jay

Friday, August 27, 2010

Review Data & Graphs

C wave LOW at 1040, was a loss of 180 pts, = or 2x fibo 89 from 1220
rebound high of spx 1128 rebound to 1039 on the 25th = 89 pts

now expecting rebound to 1069 and or 1085 on Monday Aug 30
38% to 50% of the previous loss

From there, we might expect a fibo loss of 144 pts in what i see as a "C" wave
which could also be equal to 180 pts thus taking the spx in a range from 940 - 900
ALL within the time period from Aug 30 to Spt 3/7th

Jay

I made a note at the time that this was only a general trend graph,
and EACH day was not cut in stone

SO Far, it has been quite good expect for yesterday

Also see the graph from Columbia1 which shows the low at 1039 as possible C wave low

IMO< we should now expect a rebound in an X wave, some see it as wv ii, and others wv iv
matters not at this point how you label it

We mentioned fibo relationships with potential highs at spx 1069 to max at 1085


Also mentioned GDP revision would be beneficial for today's open and the spoos are
up near 8pts at 9am

IVE published the FIBO relationships for the 377 tr day LOW on SPT 3rd several times
and there are several other pivots meeting on the 3rd.

Ive POSTED SPT 7th at 10am as BUY BUY BUY
and as far as Im concerned that is cut in stone

ENERGY next week
Monday Aug 30 up

Tues hi at 10am, then DOWN day
Wed down
Ths up to at least at 26hrs at 10am
Fri down - should be the LOWeek and maybe LOYear
Monday Spt 7th low at 10am- 39 hr cycle & 62% /13 day

Jay

Thursday, August 26, 2010

Afternoon Commentary

NOTE the fibo dates & timing

144 is FROM FEB 8th low = SPT 3rd -lo to lo
377 is from March 9th low = Spt 3rd lo to lo

This is FROM MY DAILY SPREAD sheet which keeps a record of TRADING DAYS ONLY

THEN
we must ADJUST For each NOV & DEc as there are 2 days that trade till 1pm only and count as half
days- THUS WE MUST ADD ONE FULL DAY
making SPT 7th the ACTUAL LOW

Now, note
Spt 3rd could be the CLOSING LOW
and SPT 7th the AM intraday low which is ALREADY SETUP
on my radar and blog as such at 10am

Jay

ABC at 1040 - X rebound now in progress

Its a REALLY simple case of a sell off from August 9th is an A _ B _ C decline
as Columbia shows ---
THEN
IMO, -- an X wave rebound dead ahead, and Fibo does not count for wave 4

skip ahead a bit
However, the 377 tr day cycle is closing in on SPT 3 and or 7th
Many timers forget we LOSE 1 day each NOV & DEC- there are 2 -1/2 days
so an accurate count would take us to the 7th and on the 7th there is a reading for
early disruptions at 9:49AM which coincides with the 39 hr cycle
________________________________________
NOW back to the present & How to make $ in the next 10 days

Rebound potential
Look at the first abc from 1220 to 1040 = 180 pts & rebound was 50% = 90pts to 1131
Recent -Aug 9 to 25th 1131 - 1041 = 90 pts
expect Rebound 50% = 45pts which gets us back to 1085-1090 area

BUT its NOT a straight line
8:30 Futures jumped to 1060 on not so bad jobs news,
and as of 9:15 have backed off a little.
but watch for buying opp at 120bars at 10am, after initial higher open

If you missed the above OPP, then look possibly for a sell opp Late today
Tomrrow should open exact opposite of today on GDP news as the catalyst.


PLUS there are
3 CYCLES converging that support such a scenario
14.6% / 13 day @ 10:20am
39hrs at 10am
204bars at 10am
this pivot low should offer a second buy opp leading to a high Monday at about noon


From AUG 30th- Monday's HIGH, we can expect the NEXT A_B_C lower
to make the NEXT BIGGER BUYING OPP from SPT 7th to 20th

I hope this clears up whatever mystery is in any one else's mind
OH yeh
NO CRASH IN 2010
Look at YEAR 2000, a secondary TOP hit at LABOR DAY, but this year its a secondary LOW
The bad year was 2001 with the 9/11 event as prominent, but I doubt we will see anything
like 9/11 in 2011, but stocks should be fairly weak all year, and of course it was 2002 that really set the lows in October 2002 and March 2003- so we PLOD along with NO solid direction till March 2013.


BACK TO NEXT WEEK- and you thought I forgot-[g]
Monday mid day high-
Tuesday & Wed LOWER
Spt 2nd HIGHER
Spt 3rd starts out stressful & concerns remain
Spt 7th starts out unstable, but gets better
Spt8th - is most important - Offers a FRESH START

more later

Jay

Wednesday, August 25, 2010

Aug 26th EKG preliminary

Except for the open, we have an UPDAY in store for tomorrow.
Jay

AUG 25th EKG

this one did not work out s well as it shows
THE 26 HOUR CYCLE & 13 day CAME IN RIGHT as scheduled, but the EKG made it look like a late sell off was going to happen, and IT STILL MIGHT , but as of tomrrow's open

Jay
Im really not sure what to make of the above
but the futures at 8:45 are modestly lower and would open at 1042 area-

This is NOT a resounding Bottoming type event, but do we really expect it today

GUESSING - IF 11am at the 13 day cycle finds the spx under 1040, then a rebound to 1050
would set up a later drop possibly to 1030, if the above EKG works out.

EKG shows late day gaps, { GREAT IF IT HAPPENS} but I really dont expect the mkt to behave that way also--

Todays energy STILL reading negative VIBES
and Tomrrow MUCH more positive thru Monday

SPOOS getting weaker as I write this at 8:55am, and IF they dp open under 1040, it is POSSIBLE to make the 10am-11am low at 1030

One would think that a break under 10K Dow would set off an avalanche of selling??
BUt we also might expect 1040 to hold this AM, but not later

Chat roll is up

more later
Jay

Monday, August 23, 2010

August 24th EKG & commentary

Couldnt get any better
Jay
Original was published Yesterday at 7:27PM, and did not include the END OF DAY depiction
as ABOVE, but as You can see by the FUTURES at 8:30, its going to be a BEAR eopn

SO much for Chris Carolyn, Charts Edge, and others who are STILL HOLDING onto Aug 25th HIGH- Aint gonna happen- They forgot to read or ask JAYWIZ

NOW, when THOSE people ARE SCREAMING crash by Aug 31 as some one has been publishing with Google ads, then we KNOW its time to SHIFT gears and look up.

And speaking of Google ads, they are a really good source of much information often not found anywhere else.

Todays read indicates Chaos & Confusion- I wrote that SEVERAL TIMES
Go with the FLOW today
draw on your inner strength to make it thru the day
Expect discordant emotions & upsets

AUGUST 25th is a date in stock market history that stands out OFTEN as a HIGH
BUT {{THIS TIME}} TOMRROW is PARAMOUNT as a LOW at 10am to 11am.
not THE LOW, but just one step down along the way-- Typically the ""slope of hope"".
in a long extended bear market.
Cycles converge TODAY
55 tr days June 7th [[ lo to lo ]]
466 tr days Oct 15th, 2008 lo == 410 fibo + 55- off by one day
288 tr days 7/2/09 = 144 x 2

THEN
what so special about tomrow at 10 to 11am?? you ask, good question- heres the answer
1. 26 hours
2. 60bars
3. Neg energy
all at 10am
PLUS
13day cycle at 11am
THIS MAKES TOMORROW Morning A PIVOT LOW

WEd Aug 25th
Expect CHANGE & spirits LIFT

Thsday
ENERGETIC

Fri
Poor start- better later

Monday = Promising morning, but negative shift later on

MORE LATER
Jay


I DONT think that mid day retracement wave will come to much if anything at all
more later
Jay

August 23rd EKG

EXCELLENT
13 hour cycle high at 10am

Jay

Sunday, August 22, 2010

ENERGY DEPICTION for next 10 days


________________________________________________
HERE is the DAILY OUTLOOK that matches the above graph

The above happens to Match Lavoie's SPX 500 Graph,

Helges daily graphs are confusing depending on which one your viewing.
graph 7A shows 25th as a trough
_____________________________________

Daily Energy expectations

Monday Aug 23rd
Frustrating & TENSE day
pivots =204bars at 3pm, or 210 @ 3;30


Tuesday
Arguments continue
& Upsets
Draw on inner strength & make changes
258bars at 12:30 or full moon at 1pm = 270bars

WEd
Be OPEN to CHANGE
SPIRITS LIFT
26hrs at 10am
13 day at 11am
Energy effect = confusion at 10am

Thsday
ENERGETIC

Friday
Poor start- better later

Monday Aug 30
Promising start
unpleasant surprises later on

Tuesday
Early confusion
better ending

Wed Spt 1st
BAd news & tension
stressful day

Thsday
OPPOSITE OF YESTERDAY

Friday Spt3
Stressful morning
better later
Stan Harley cycle of 377 trade days from March 9 , 2009
_____________________________________________
more later
Jay


Saturday, August 21, 2010

Whats on my Mind today

The ABOVE graph from COLUMBIA- CLEARLY shows an ENDING DIAGONAL TRIANGLE topping on August 9th at 1131.
I dont know HOW many of you have traded during such a wave,
but what follows can get very ugly

Ive written out the timing since the Aug9th b4- go to the main page & scroll down
WAVE 1 low at 1070
wave 2 rebound at 1100 in a flat - ALSO CONSIDERED VERY WEAK
There has been TWO Hindenberg OMENS this week, plus the big one on MAY6th.


the above graph is a LONGER view from APART OF NY blog pages
APRIL 26th TOP at 1220
May 25th low at 1041 -WAVE {A}
JUNE 21st High at 1131- WAVE {B}
JULY 1st low at 1010 -- WAVE {a}
August 9th High -EDT- WAVE{b}
NOW INTO a WAVE {c of C}
wv i to 1070
wv ii to 1100

If theres more, i'll add it alter
Jay
I dont care if P3 has started or not
___________________________________
REPEAT WAVE HOURS

Off Aug 9th
wave 1 lasted 26hrs
wave 2 will be 19.5 hrs tomrrow AM

If I'm right about wave iii
should be 26 hrs from tomrrow AT 10am till 10am Wed, 25th

wave 4
19.5hrs to Aug 30th at 10 to 11am
wave 5
might go 26 hours to Spt 3rd at the 377 tr day mark at 10am

_______________________
Now lets look at some math, IF no crash of at least 13% next week,
then what should we be looking for as a low?

WV 1 of 5--1128 to 1111 lost 17 pts
WV low hit 1070 - lost 58 pts
thats a multiple of 3.41

Next wave degree
1100 - 1064 lost 36pts
36 X 3.41 wave equality %age wise = 123 pts
1100 - 123 = 977

CYCLES & Bar count is pointing right at Tuesday at 12:30 to 1pm

more later
Jay


Friday, August 20, 2010

Friday August 20 EKG

Another GOOD representation
Now at 69.6%
will go out for big dinner at 70%-- [gg]
Jay


GOOD START- keep it going
Broke under 1070, and now testing it at 11am

Failure here should mean much lower
Jay

Thursday, August 19, 2010

August 19th EKG

I'll take that as a resounding success
OK for a start, but I had been expecting more from my bear friends
Lots more coming next 3 days
Arms today was only 2.85
PC ratios came in at 90% bearish
Jay

So far so good
Down open, and some recovery
10am = Neg energy
39hr cycle, and if hod, even if only a recovery high ,then lower we go
10am = LEI & Fed survey data


Jay
SPOKE too soon
its now 9:55, and they are tanking
High might have truncated at 9:45, and I bot in just in time- now short
didnt want to wait for 10am

____________________

Off Aug 9th
wave 1 lasted 26hrs
wave 2 will be 19.5 hrs tomrrow AM

If im right about wave iii
should be 26 hrs from tomrrow AT 10am till 10am Wed, 25th

wave 4
19.5hrs to Aug 30th at 10 to 11am
wave 5
might go 26 hours to Spt 3rd at the 377 tr day mark at 10am

All we need now is for some one to strike up the band
____________________
its now 10:15am
And guess what, the BAND is PLAYING my TUNE

more later
Jay

Wednesday, August 18, 2010

Elliott wave Graph from Columbia


WAVE i low at 1069
wave ii now in progress and might complete at OPEN tomrrow morning at 1106
which is the 62% retrace level as shown above

LEI & Fed survey at 10am could act as the trigger
as 10am = 39 hours cycle & a lunar negative with
Uranus which is the master of shock & awe

Jay

August 18th EKG

EXCELLENT


Yesterday marked an 8 day high, thus today marks an 8 day TURN

and it came unexpectedly on the open

180bars at 11am today
204b@ 1pm
228b @ 3pm

Any rebound appears LIMITED

Neg Energy at 3:52pm

Tomrrow should continue lower

Jay


Jay

Tuesday, August 17, 2010

AUGUST 17th EKG

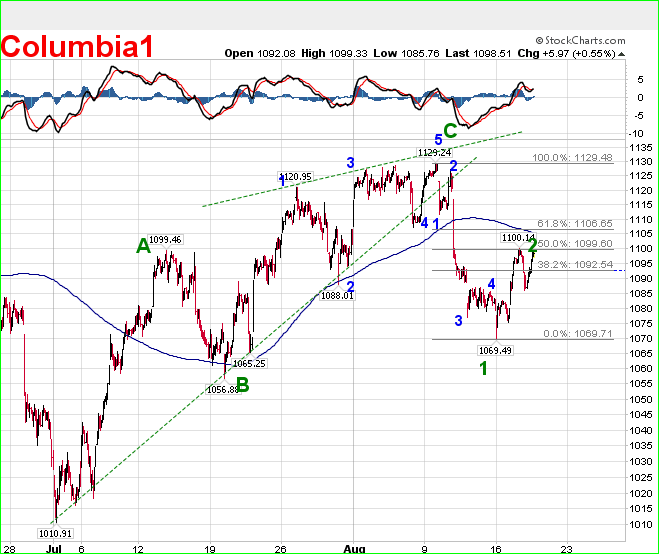
Once again we have SUCCESS with the EKG still at 68%
and it appears the OBV & macd indicate a lower open for tomrrow
150bars @ 3pm was only a momentary blip on the way down off the earlier highs
BUT tomrrow could give NO REAL evidence of weakening until late in the day
Repeat the reading - $ wasted & avoid risk

Jay
Today's energy as previously described is BENEVOLENT

But after today, we will see the real identity of the CURRENT WAVE, and it is
NOT benevolent.

It will LEAVE NO DOUBT what has happened, but the major move will come
from the energy coming this WEEKEND SHOCK-
the kind that we havent seen in a long time.

That will SETUP the WKEND FEAR SYNDROME that will follow the
MARKET higher as it climbs a WALL OF WORRY , but all that will WAIT until
AFTER THIS WAVE ends on SPT 1st, making it into next year- to be discussed later.

YES, as noted before, of course there are setbacks along the way,
but on August 24th, the ARMS 5 & 10 will be DRAMATICALLY higher leading to a TECHNICAL rebound as mentioned above.

I had previously NOTED the WAVE structure that I anticipate from
NOW till Spt 1st, but here it is again.

The EDT ended on Aug9th
wave 1 ended yesterday at OPEN
wave 2 ends today, and or tomorrow AM
wave 3 ends possibly on August 25th, and it should take the from of FIVE waves of its own.

It is also likely, to expect the mkt to LOSE 10% by Friday August 20th
from its original high on August 9th at 1128 = 1015 Approx value

and the OTHER 20% in wave 3 of 3 of 3 on Monday August 23rd
leaving [4 of 3] & [5 of 3] for the 24th and 25th- expect INTRADAY WILD SWINGS

wave 4 to complete on or about August 30th in the AM
& last but not least
wave 5 to complete by SPT 1st

more later
Jay

the mkt next 2 weeks should emulate the 1987 CHART I published

Fascinating time line -- USING the 377 Day CYCLE identified by Stan Harley
A Major cycle low was due in April 2007
but it occurred on MARCH 13& 14th, 2007
Add 500 tr days get us to MARCH 9th, 2009
Add 377 trade days = Spt 3rd, 2010
As previously mentioned, August 24/25 falls within the 370 to 377 tr day cycle

Monday, August 16, 2010

August 2010 compared to October 1987

Look carefully at the above graph

Note that only about 10% was lost from the Oct 6th high to Friday Oct 16th, 1987

the 20% drop was on TWO DAYS ONLY - Oct 18 & part of the 19th
This comparison would suggest a similar event occurring this year on
August 23rd - 24th, & possibly part of the 25th

I know that MANY techs are NOW looking at LATE October for a possible
time frame for the above -But be assured, the energy in October is
NOT there to coincide with that type of market event

IN Addition,
even tho the energy appeared unfriendly in Late July & early August,
it was MISREAD by those who compared it with similar HISTORIC events of the past.
BUT, a more careful interpretation of those prior dates would have revealed
a more benevolent behavioral association. Thus there was NO sell off at that time

Just because we did not fully understand the associational relevance then
does NOT mean the same thing NOW.

Jay

August 16th EKG


It would appear that most of the action could occur near the end of the day today.

50%/ 13day cycle @ 2:30pm
60bars @ 2pm

Jay

As happens many times, we can EXPECT that sharp downdraft
TOMRROW AM, instead of close today.

26hrs at 10am & 90 bars at same time
55%/13 day at 11;59, should set the stage for afternoon recovery

Jay

Sunday, August 15, 2010

Elliott wave Graph from Columbia


The above Chart from Columbia shows that Monday SHOULD close lower

How much lower, you ask? good question
all we can do is look at fibo possibilities

Spx 1128 - 1080 = 48pts

spx 1080 - 48 pts = 1032 possibly

possible Projections
That should complete wave 1
wave 2 should finish on Tuesday and or wed AM
Wave 3 next can break into 5 waves of its own ending on the 24th, or 25th
Wve 4 next 3 days
Wv5 end on spt 1st.

Jay


Daily Readings

Energy & daily readings for the next 10 days
Aug 16th, Monday =
Poor focus- caution with $

Aug 17th, Tuesday=
Happy influences
good day for $
Dont believe the majority

Aug18th, WEd
Opposite of yesterday
Avoid risk
$ will be lost or wasted

Aug19th, Thsday
Dont make $ deals
overwhelming fear

Aug20th, Fri
Repeat of Thsday in the AM
postpone $ deals
Better in the evening

Saturday, Aug 21
blockages & frustrating

Sunday, Aug 22
best plans fall apart

Monday Aug 23rd
Tense & frustrating
troubles continue

Tuesday, Aug 24th
Arguments & aggravations

Wed Aug 25th
CHANGE
Spirits Lift
better by days end

Thsday , Aug 26th
ENERGETIC

Friday aug27
Poor start
better later

Jay


Friday, August 13, 2010

weekend comments - WARNING

Its only Friday at 7pm, but THIS IS A WARNING

Monday should show the FIRST KINK in BULL armor

and by Tuesday afternoon, most will think the WORST IS OVER

BUT TAKE HEED, Monday will be JUST THE BEGINNING

I will publish the daily readings for all of next week into the 24th & 25th

I have had the 24th on my radar for a MAJOR LOW,
but the TURN might actually be the 25th at open to 10am.
more on that later

WHen its ALL OVER, EVERY ONE will be able to say
that JAYWIZ predicted the CRASH of 2010, WELL IN ADVANCE
and that lots of Money was made and or saved because of it by those who
read this blog.

Jay


August 13th EKG

Excellent depiction - score another success day for the EKG
NOw operating at 68%
Jay
Just as I projected for today
MUCH ADO ABOUT NOTHING

However, MONDAY is a very different story,
and should offer the bears some attention

Today's 13 hours at 10am did provide a high,
and from all appearances it should have been the HOD

210 bars hit a low at 11:30
228bars @ 1pm
258bars @ 3:30pm could allow a higher close

Monday has strong negative influences, and could be quite a bearish day

More later
Jay

Thursday, August 12, 2010

August 12th EKG

I was sort of expecting a much lower close, but this will suffice, and possibly we will see
the 13 hours low tomrrow at 10am, BUT if its a high, that will actually work even better
especially if its the HOD.

As I mentioned earlier this week, there is really NO energy this week to drive prices lower

ALL the NEGATIVE energy is concentrated on the 18th to 24th

Jay
today's EKG shows the same outllook as the daily reading,
and since they confirm each other, I decided to publish it at least for today

Todays read says the picture brightens till about mid day
of course thats not withstanding the lower open, but there has been improvement AFTERWARD, & now we realize improvement does not have to mean right from the open

The Latter part of the day indicates STRESS and DELAYS with a warning to run for cover

Make it so, said the captn

Jay

Wednesday, August 11, 2010

August depictions

ABOVE graph is from SPIRAL calendar web site
Above graph is from Alphee Lavoie web site

Above graph is Jaywiz POWER data thru Aug 17th


Lavoie graph for SPX seems to EMULATE the Jaywiz graph, and we do not CONFER
with each other at all

Chris Carolyn, Spiral cal at the top uses ONLY LUNAR data, and for the MOST PART
FULL MOONS Are like the energizer bunny which IVE mentioned MANY TIMES, generally LLIFTS the mkts, and IF the FULL moon at 1pm finds the Mkt at the hod, then the lod could possibly occur at 10am the next day.

BUT this FULL MOON has CHAOS & Confusion ALL OVER its face.
Pisces & virgo- anyone with knowledge about those two types
is welcome to comment
Pisces read= Discordant emotions can cause upsets
Virgo read = arguments - keep common sense in mind

Jay

August 2010 DEBACLE

ADDING 2 +2 =

Reviewing the current status in relation to the energy about to be unleashed in the next 10days, Im still on track for a melt down next week with greater emphasis on more serious days on the 20th to 24th.

Repeat what I wrote before
BLACK Friday August 20th
Blacker Monday August 23rd
Final lows on August 24th Mid Day


I projected a math model that STILL might go all the way, or might not go that far, BUT IT MATTERS not what level the spx ends at, IMO< it matters WHEN as more critical. SINCE the BRADLEY date had been published as August 11th, and the market made a closing high @ 1127.70, it appears to me that AUGUST 9th represented an important high, marked also with a 55 & 72 week cycle convergence at the same time.

ALSO under scrutiny is the Elliott EDT formation that has been forming since the July 1st lows at which point, the spx dropped to 1010 from 1131 in about 10 days. There are a few ways to label each leg since the April26th HIGH at 1220, but to keep it simple, imo, we had a wave [A] low at 1010,

now wave [B] at 1128,

next looking at a serious [C] wave. Some have labeled April 26th as the TOP of P2, but I really think it was only wave 3
of P2, now in wave 4 of P2 which is about to culminate at about the 50% of the difference at 785.


using FIBO math, we can guesstimate what levels should be reached in this next 10 days as I showed b4.
1220- 1010 = 210 pts
210 x 62% = 130 + 1010 = possible high of 1140, got to 1127
210 X 1.618% = 340
take the recent high of 1128 - 340 = 788 as potential for the next LOW

SYMMETRY
All time high @ 1575-900 = 666 on March 9th, 2009
1575- 50% of 900 = 450 pts = spx to 1125 got there twice so far
785 = 50% of the 1575 high

More later
Jay
Ive suspended publishing daily EKG for now as I see the August outlook as MORE IMPORTANT


______________________________________________

Today has a 39 HOUR cycle pivot due at 10am and the DOW futures are off 121pts at 7:30am pointing at that low and or 11;26am at 23.6%/13 day before heading back up later in the day & The read for the day agrees with that outlook.

Sunday, August 08, 2010

August 2010 -Math to Think About

There is a math model which im sure no one will believe
at this time but here it is anyway


Ive mentioned the CYCLES before a few times
The next 12 days has
Aug 10th & 24th MAIN cycle lows
as Ive published several times

Aug 10th=
55wks July9th, 2009
72wks March 9th, 2009
Aug 24th has 3 fibo cycles and a
CHAOTIC FULL MOON

Spt 1st will play an important role as a MAJOR PIVOT
leading to a strong rebound nearly all of September, but more about that later.

Heres the math
1220-1010 a price level that I nailed several weeks ago = 210 pts lost
210 X 1.618 = 340 pts
spx 1120 - 340 = 780, a level that was mentioned to me by other analysts also

This would also represent a 30% loss = to the crash of 1987
the total loss from 1220 = 440 pts or 50% of the 900 pt loss in 2008-09
this event would take the dow to about the 7000 level

Most likely the MAJOR emphasis will occur in 3 days
black Friday Aug20th
blacker Monday- Aug 23rd
Intraday low - Aug 24th


more later
Jay

weekend comments

This weeks readings

Monday
Wasting resources
Caution with $
expect challenges

Tuesday
group Plans dont hold
upsets & problems multiply

Wed
Edgy day - ups & downs
people not reliable
better later

Thsday
Morning peace & quiet
picture brightens
stress in afternoon

Friday

Sociable
Good vitality


additional readings
Expect CONFUSION & deception on 8th,9th & 10th
Stress continues 16th to 20th
more Unexpected events on 21 to 23, coming to a head on the 24th
20th to 23rd - need to make some serious decisions
24th on = get needed relief

the configuration of Aug 16th is similar to to 1930/1931 with minor variations
and the economic climate is unlikely to be as severe as it was in 1930's. The Dubai
event took place under a similar placement as on the 16th.

more later
Jay

Friday, August 06, 2010

Aug6th EKG

The End of the day rebound was in progress on the EKG,
but I did not publish it that way as it was not complete as of the pub time

It would APPEAR that the EKG for yesterday
ROLLS over into Today thus making is a successful publication.

It would also appear the EDT may have completed
without the FINAL thrust or an outside day.

CYCLES come into PLAY NOW in a BIG WAY, no matter what the news,
oh I mean NOISE

Some tech's had yesterday as a CIT , and considering we aer now at an 8 day turn
it would seem that was a logical call

13 day low due at 11am today, but could be over ridden by larger cycles
or the next 13 day cycle on the 25th at 11am

A low midnite tide is an influence today also

Any recovery should top today at about 2pm on an energy high

60b @ 10am
90b @ 12:30pm
120b@ 3pm

more later
Jay

Thursday, August 05, 2010

August 5th EKG

13 hour cycle at 10am today
rebound energy high possible from noon to 1pm, or even 3 pm
Is today the CYCLE TURN ?

Running out of Time ?
It typically takes 13 tr days to get to an important bottom
Aug 5th to Aug 24th, relates to similar day count as in Oct 1987

Jay

Wednesday, August 04, 2010

August 4th EKG & SPX comparison

The last 3 days have been good but obviously not perfect
today's close does seem to point to a lower open for Thsday as all the lower indicators
are headed that way at the close.
Jay


today seems to have a positive bias, but dont expect the moon

Heres an interesting & pertinent TIME LINE

Oct 9-10, 2007 = Dow top at 14k
+233 tr days
Spt 15th , 2008 dow low at 10,900, but got lower in October
+233
8/17/09 no significant events
+233
7/29/2010 within a day or 2 of August 2nd highs


Now refer back to next weeks convergences
Aug10th is 360 tr days from Mar6
Aug 11th is 360 from Mar9th & 275 tr days from July9th
360 tr days = 72 weeks which is 1/2 of fibo 144
275 tr days = 55 weeks fibo


FWIW, Ian and another timer friend both have August 5th and or 6th as a major CIT
which obviously appears should be a turn lower according to the above time lines
in addition to the energy readings for next week .
Also
Aug 11th at 10am is a 39 hour cycle pivot
Jay

Tuesday, August 03, 2010

August 3rd EKG


39hrs at 10am
78.6% /13 day at 12:25
90b@ 10;30
126b@ 1:30
156B @ 4pm

Those who are waiting for the typical fall declines in October are probably going to be sadly disappointed. The PROBLEM time appears to be from NOW till Oct 4th, as Ive mentioned several times and given data in reference to that date.

more later
Jay

Monday, August 02, 2010

August 2nd EKG

Futures this morning confirm an UP open

Energy highs are possible at
10:30am
and
1;38pm

Cant tell if the day will close off the highs, but it does seem likely

The daily read calls for smooth sailing & advancements

30bars @ noon
&
60bars is due @ 2:30pm

more later
Jay

Sunday, August 01, 2010

Elliott wave Graph from Columbia

from Columbia's public blog
looks like W3 might be dead ahead, or at least 1 of 3 of P3
~~
And My Aug energy graph also shows a very dangerous time period from the
17th to the 24th, a full moon with a bad temper this time.
Aug 11th is 360 tr days from March 9th as an important cycle ,
BUT THEN add 17 more days for that MAGIC 377 of Stan Harley fame, to get to Spt 7th, new moon day.
At the SAME time Mars & Venus make conjunctions with ARCTURUS- also know as the great
BEAR watcher

Friday JULY 30th EKG if it had been published

Monday will be ready for publication in the morning
but it currently does show a lower open

Jay