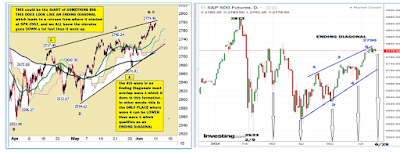
A VERY ACCURATE FORECASTING TOOL
FOR VIEWING NEXT DAY'S ACTION>
WE NOW SEE 2mrw AM dropping until noon most likely, but we havent seen the end of 2mrw yet on the graph
USE THIS MODEL AS A TEMPLATE to identify which day is being portrayed on the graph.
SEE where the DAILY outline is BOXED in. and we use EDT time on the bottom row.
USING DAILY graphs is similar to adjusting our TV's in the 1950's with telescoping rabit ears antenae. THE longer term graph such as the PD becomes the TV picture when the TV is turned on.(without a remote, I might add) THEN we get a clearer picture by raising or lowering and rotating the rabit ear
antenae.
TRADE W CONFIDENCE
Jay


