JOIN TODAY AND LEARN MORE ABOUT HOW SCIENCE can predict stock market behavior before it occurs and be ready for what is coming., NO MATTER WHEN !! TRADE WITH MORE CONFIDENCE Jay
THE Jaywiz BAR CYCLE GRID can helps us align daily action with pivot lows, Combined with the Bradley and Tide dates we can SEE when to expect turns and pivot lows within a few minutes of the due times.
KNOWLEDGE IS MORE THAN POWER ITS MONEY TOO. HERE IS LAST WEEK'S JAYWIZ "POWER DATA"
NOTICE this was published to the Jaywiz VPN group BEFORE week began, which means we had PLENTY OF TIME to map out a trading strategy for the WHOLE WEEK AHEAD.
THE JAYWIZ POWER DATA is PUBLISHED depicting the WHOLE WEEK AHEAD on or before Sunday at 7 pm EACH WEEK.
SEE the FUTURE BEFORE ANYONE ELSE GET IN FRONT of the Market STOP GUESSING
SIMPLE EASY TO VIEW Graphics
The market has done EXACTLY as projected via the Jaywiz POWER DATA --
UH OH whats expected for 2mrw ? WE are expecting the mkt to sell off the next 2days, POSSIBLY as much as 3%; but dont hold my feet to the fire if its less than that.
JOIN TODAY AND BE A WINNER** MAKE MORE MONEY!! TRADE W MORE CONFIDENCE** Jay
THE BEST WAY TO USE JAYWIZ DYNAMIC ENERGY RESOURCES is as a supplement to YOUR OWN SYSTEM or knowledge for TRADING the stock market. THUS you can CONFIRM your own work OR allow you to make any needed adjustment to match the forecast graphics.
WE have also recently set up a diagnostic system where the longer term forecast graphics are confirmed by the shorter term. IF we find a discrepancy, then we go about doing more research to determine whats next. NO ONE GRAPHIC STANDS ALONE.
CONFIRMATION of a swing trade comes from comparing and coordinate the dynamic energy graphics to depict what is coming next. Thus it becomes a VISUAL forecast that we can watch unfold as the days, weeks and months go bye. JOIN TODAY BE IN THE KNOW LET SCIENCE guide YOU to making more $$ Jay
Jaywiz "POWER DATA" week of August 17. MID WEEK Low touched 2802 @11am
Jaywiz "MOTO" DIRECTION**DIRECTION** DIRECTION MKT Up on days indicated MKT down on days indicated note that (DEPTH is less well depicted than direction)
JOIN TODAY & SEE the FUTURE w MOTO up to one month ahead
HINT about NEXT WEEK MKT will start out the week strong - FADE to a mid week low on the 22nd / 23rd = Rebound on 24th - PD shows this action very clearly NOTE ( ITS SO EASY TO SEE with GRAPHICS)
THERE Is NO SOFTWARE to learn NO IF this , then NO mumbo jumbo NO long paragraphs about the past. NO GUESSING about the FUTURE
JUST simple easy to understand the VISUAL Dynamic Energy Graphics. of FUTURE stock Market Directional swings JOIN TODAY Use the first 90 day membership as a TRIAL If not happy with your trading results, then just don't renew Jay
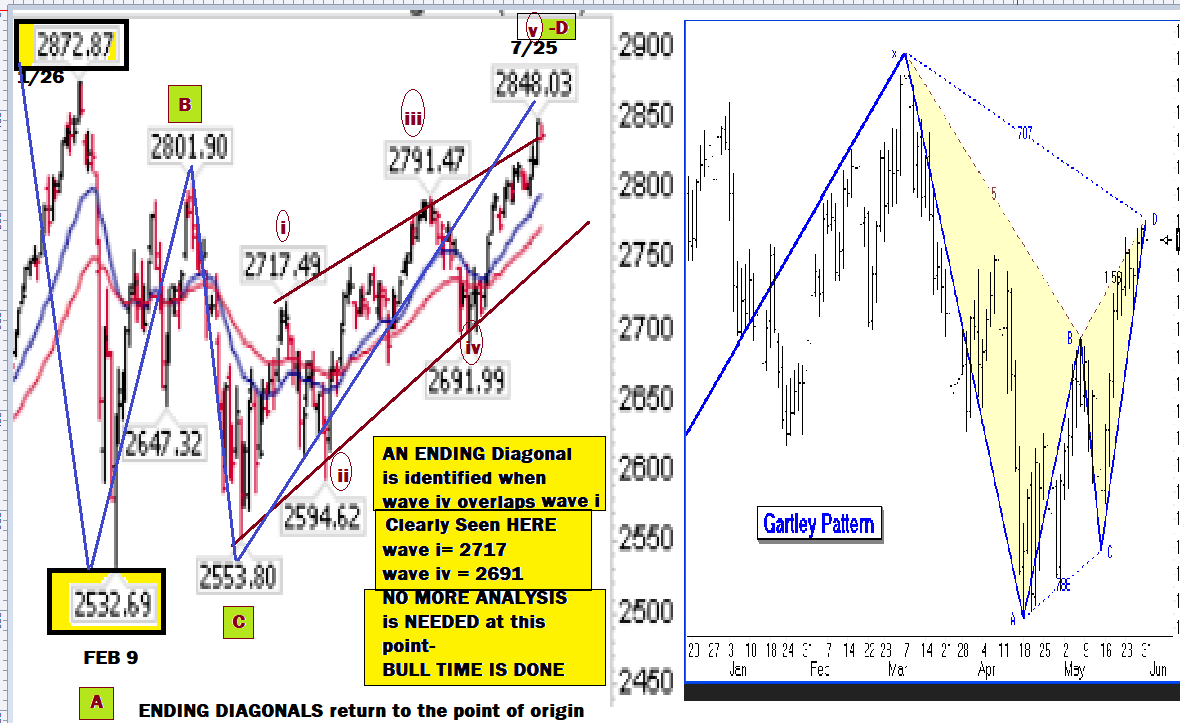
WE had a HIGH of 2873 and a low of 2533 Rebound to 2848
NOW WHAT ???
We are expecting a PIVOT LOW to be reached in AUGUST from which a rebound should last about a week with another LOWER LOW at the END OF THE MONTH.
FOR EXACT details invest a measly $150 for 90 days of daily updates, can help you make you $$$$$ THOUSANDS.
HERE is the JAYWIZ MOTO graphic for THIS WEEK.
note that AUG 3rd does not have to be lower than August 1st but it can be. depth/ magnitude of any price swing does not have to be a match to what we see for ENERGY shifts. JOIN today and get this dynamic energy graphic for the WHOLE MONTH. EVEN IF the exact turns can be (+) or (-) a day, Whats MORE IMPORTANT w the MOTO is DIRECTION and a lesser emphasis on depth
GDP 4.1 % -- HO HUM- its not the NEWS that makes the market move, its the TIMING.
IF YOU were a VPN member, YOU WOULD NOT HAVE BEEN SURPRISED at today's lackluster reaction to the GDP report.
$150 gets you 90days of DAILY UPDATES to monitor SCIENTIFIC GRAPHIC ENERGY updates. MONEY WELL SPENT TO SEE THE FUTURE. BE INFORMED AND KNOW WHAT TO EXPECT.
WATCH THIS JAYWIZ POWER DATA , weekly GRAPHIC REPORT
JAYWIZ MOTO, MONTHLY GRAPHIC REPORT
SEE how well the SPX followed the MOTO guidance road map- THIS GETS PUBLISHED to the VPN GROUP- BEFORE the start of the new month' JOIN TODAY Jay
NO!!! the BULL IS NOT DEAD but IN a temporary FIX Called an ENDING DIAGONAL Inferring the MKT HAS GONE AS HIGH AS IT CAN GO and is NOW EXHAUSTED in other words
BUYERS are either OUT OF $$ or OUT OF INCENTIVE to BUY more.
SENTIMENT is dripping with DROOL as those perenial bulls are chomping at the bit to buy more- THEY ARE SUCKED in and cant get out.
HEY, Mr trader, TAKE OFF THOSEROSE COLORGLASSES !!
JOIN TODAY AND BE IN THE KNOW STOP GUESSING SCIENCE and TECH join here to provide PRECISION TIMING JOIN TODAY Jay
Joe Granville struggled for a few years even after he gained some fame in the 1980's. Ive only been working with DYNAMIC SCIENTIFIC ENERGY for a few years now, so fame is still elusive for me. WILL I become known as the father of APPLIED SCIENTIFIC STOCK MARKET ANALYSIS ?
JOIN today and SEE the NEXT 10% correction coming shortly Jay
THE JAYWIZ "MOTO" data graphic shows us exactly what to expect every day for the next 2 weeks of JULY.
THIS IS NOT AN IF < OR < BUT ITS REAL and DEPICTS DIRECTION WITH GREAT CLARITY.
HERE IS the RESULTS from the FIRST 2 weeks of JULY 2018 - WE CAN SEE a clear 80% + CORRELATION to what was projected by this amazing DYNAMIC SCIENTIFIC ENERGY EFFECTS DATA graphic
DONT WAIT - JOIN TODAY IM not getting any younger and additional money is not a priority any more.
YOU CAN SEE HOW WELL the SPX matched up with the PROJECTION that was published to the VPN group BEFORE July began.
THE EKG presented on Friday was incomplete- Jeesh there he goes making excuses-- NO, not excuses, just incomplete data WATCH the UPDATES and COMPARE
NOTE FRIDAY, JULY 13th, the DAY ends where it began. BUT NOW we see the 16th starting lower also- WILL that translate into a bigger decline?
WE HAVE OTHER DATA GRAPHS that infer the day will head south.
WILL update those 2mrw -cant give you too much to understand all at one time. I know that I need to read things twice before my brain absorbs that data, so I will allow you that courtesy also.
JOIN TODAY AND SEE all of NEXT WEEK. WE have made some changes to the mathematical formulas and discovered what was needed.
The Jaywiz **EKG** was one of the FIRST SCIENTIFIC RESOURCES utilized to SEE the MARKET ONE DAY AHEAD.
AT first there was 3 models, of which 2 did not stand the test of time and failed the consistency test -which is simply averaging an 80% correlation to the actual SPX on the next day projection. THUS, THEY WERE ELIMINATED!
JAYWIZ EKG JULY 9-2018
HERE is some previous examples WATCH how to READ IT CORRECTLY.
NOTICE where each new day begins and ends using the EDT time line on the bottom row. WANT TO SEE MORE ?? SURE YOU DO !!
NOW; IF your expecting the EKG to SHOW every TICK up & down all I can say is FUGEDABOUD IT-- but IF your a real trader and need a little help to determine when to BUY and when to SELL, then YOUR IN THE RIGHT PLACE.
HOLD TRADES LONGER ***-Make MORE $$$ KNOW IN ADVANCE if the day is bullish or bearish- DIRECTION is the KEY TO PROFITS.
WITHOUT KNOWING DIRECTION YOUR ALWAYS GUESSING STOP GUESSING WE have 4 other such resources that we use to collaborate and confirm DIRECTIONAL guidance. TRADE W CONFIDENCE Jay
THE 2 GRAPHS posted below are both indicating a BEARISH TREND HAS BEGUN from the JUNE 13th high at 2792.
WHEN WILL IT REALLY GET STARTED ? WHEN will it END ? HOW LOW WILL IT GO ? JUST what this means for TIME AND PRICE is just what we forecast every month to our VPN members.
PLUS we publish daily updates which include the most trusted and reliable Dynamic SCIENTIFIC Energy Graphs.
THIS IS THE ONLY PLACE IN THE ENTIRE WORLD where you can SEE THE STOCK MARKET FUTURE DIRECTIONAL PRICE SWINGS IN ADVANCE.