THE NEW JAYWIZ 2023

THE NEW JAYWIZ 2023
THE NEW JAYWIZ 2023

Tuesday, June 04, 2013

Market Timing-Whats Next !! June 2013 INFLUENCES

AT the start of each month, I Publish for the VPN group a listing of the MAJOR JUNE INFLUENCES  - THIS IS JUST A PARITAL which ILLUSTRATES the POWER OF KNOWLEDGE


MAY 22nd FED starts TALKING RETREATING from QE monthly suppport
Market TOPS at 1687 & Dow 15,550 to a low on MAY 31st at 1630 & Dow @ 15,100

MAY31st TORNADO wipes out whole town and kills many
Istanbul TURKEY riots
FOREST FIRES in US WEST COAST

2nd favorable spills over to 3rd and the DOW gains 140pts

"KNOWLEDGE IS POWER"
My 5th grade history teacher had this beautifully PAINTED 
at the 
TOP OF HER BLACK BOARD

STAY TUNED FOR FURTHER UPDATES
better Yet
GET AHEAD of the game
JOIN THE JAYWIZ VPN

Jay


Sunday, June 02, 2013

Market Timing-Whats Next - JAYWIZ DAILY EKG IN REVIEW - INCREDIBLE CORRELATIONS

DAILY EKG SHOWS THE INTRADAY TURNS, but the MAGNITUDE is not depicted as well. IT IS NOT USED To see a weekly TREND either- EACH DAY STANDS ALONE. VPN members get to see it ONE DAY IN ADVANCE-


THE DAILY EKG FOR MONDAY JUNE3rd is being published as I TYPE THIS note
7pm each SUNDAY TO SEE TOMORROW'S MARKET-- TODAY !!
Later
Jay

Market Timing-Whats NEXT !! REVIEW LAST WEEKS RESOURCES

JUST ONE LOOK is ALL it takes to see why JAYWIZ VPN members are doing so well.
New TRADERS are joining in record numbers in addition to an 80% renewal rate.

TOP graph is the WEEKLY POWER DATA with the 
BLACK LINE OVERLAY of the ACTIVITY INDEX
Gray line is my interpretation of daily direction
Orange line is actual spx

 IMPACT STREAM is SECOND GRAPH showing the WEEKLY TREND- 
NOT A DAILY INDICATOR
DYNAMIC next ALSO shows the WEEKLY TREND- confirming the impact

IN ADDITION WE HAD A TECH SELL SIGNAL on the 28th
May 22nd TOP came right on a Gann multiple trade day cycle from October 10,2007

POLARITY graph on the bottom for the week was ALSO NEGATIVE

The Jaywiz VPN group is NOW FOCUSED ON NEXT WEEK
Power Data will be published at 7pm tonight with ALL 5 days next week
IMPACT at 7pm tonight will show TOMORROW'S trend
DYNAMIC --    Ditto
Polarity already shows us a trend  

***YOU WANT TO KNOW WHATS NEXT -  ITS REALLY SIMPLE

JOIN THE JAYWIZ VPN for 90days- ITS ONLY $100-
You get all of the above with cycles, tech data, EW, charts & graphs,with DAILY UPDATES.
IM ONLINE ALL DAY with updates and reports for members to utilize.
YOUR TIME IS VALUABLE - dont spend it reading about what happened yesterday, last week
or last month  - 

MY FOCUS IS ON WHATS NEXT !!

SEE TOMORROW'S MARKET ---- TODAY

STAY TUNED FOR FURTHER UPDATES
Jay


Saturday, June 01, 2013

Market Timing-Whats Next - BUSTED TREND LINE

THIS GRAPH NEEDS NO FURTHER EXPLANATION
 also
THE updated JUNE ROAD MAP NOW shows MORE DETAIL FOR NEXT WEEK

and the EW graph has been updated to MATCH UP WITH the POWER DATA 

THIS WEEK We have INTRODUCED AN ACTIVITY OVERLAY on the PD which showed us
just where the market was headed, even tho the mkt fought valiantly to stay afloat.
SEE IT BELOW

JOIN THE JAYWIZ VPN AND YOU"LL GET TO SEE THE PD FOR THE WHOLE WEEK -THEN- WATCH DAILY AS THE EKG & ACTIVITY OVERLAY CONFIRM MARKET DIRECTION.


Week OF May 28th to 31-2013- FIRST SEEN COMPLETE FOR THE WHOLE WEEK                                                  
              BY VPN Members on Sunday MAY27th at 7PM.  ACTIVITY overlay is added each day   
              as it becomes available

Stay Tuned for Further udpates
Jay

REMEMBER This....
consider the first 90 days as a TRIAL PERIOD FOR THE VPN. 
IF satisfied with the results, or wish to stay in the group, then just renew when you get my reminder note.


Friday, May 31, 2013

Market Timing- Whats Next-- A SENSIBLE VIEWPOINT

I dont think  this graph needs any deeper explanation 

MY porjection for a MAY30-31 LOW has NOT MATERIALIZED
THUS
using my knowledge of FIBO< CYCLES< WAVES, ETC gets the following 
GRAPH AND PROJECTION

NOT A CRASH
NOT A TRIANGLE
NOT up to the clouds - at least not yet
BUT JUST A SIMPLE ZIGZAG
 
EVERY EW tech WANTS TO END THE FORMATION ASAP. 
but without a ROAD MAP its easy to see why they think that way

USING MATH TO TAKE OUT THE MYSTERY of the PRICE FLOW makes it much simpler

INTERNAL TECH DATA did ISSUE A SELL SIGNAL yesterday
PC ratios once again overbot
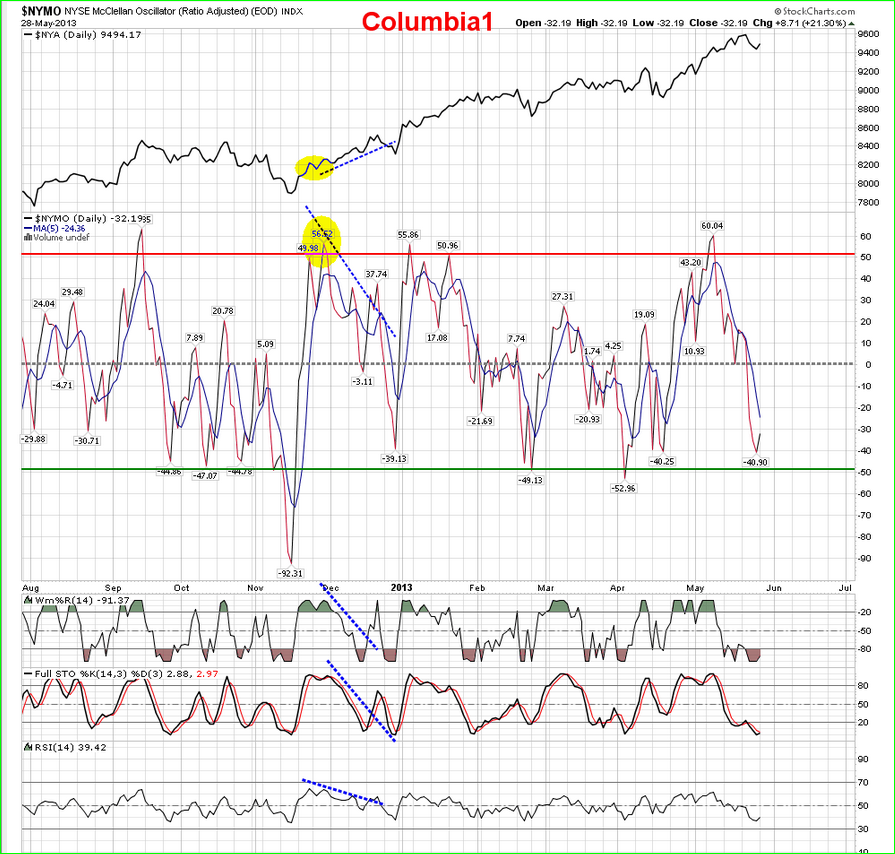
MCOS in the OVERSOLD ZONE, but the MARKET PRICE LEVELS have NOT
caught DOWN to match yet.

Nearly every MONTH has started out sloppy or lower and it would appear 
JUNE will be NO EXCEPTION.
LATER
Jay 


Wednesday, May 29, 2013

Market Timing-Whats Next !! MATH takes the EMOTION OUT OF THE GAME

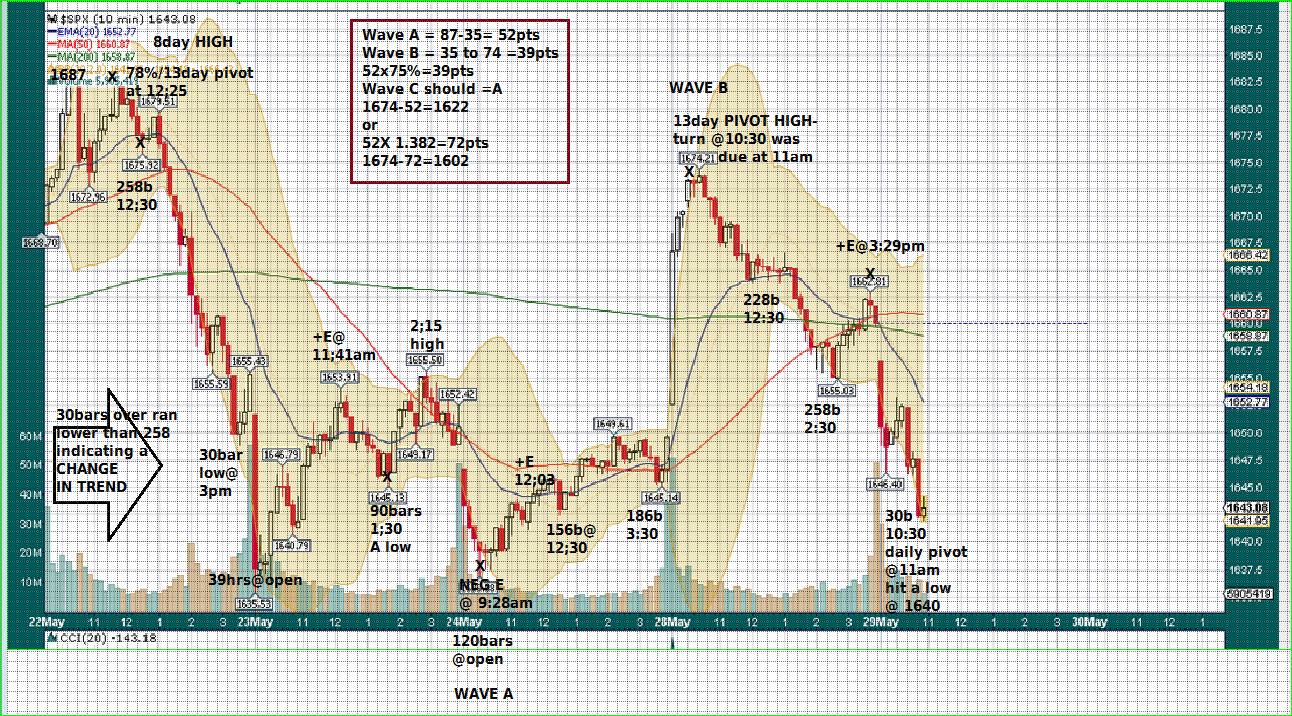
JAYWIZ  CYCLES ALSO used to PINPOINT INTRADAY PIVOTS

EW progressing as expected


NOTE THE BAR CYCLE PIVOTS as LOWS
NOTE THE 13DAY pivots as HIGHS

NOTE that EW precepts indicate the NEXT IMPORTANT LOW

USE MATH to identify PRICE TURNS
1641 at today's LOW at the 11am DAILY pivot = a SQUARE of a derivative of the FIBO #13

SQUARES & SQUARE ROOTS can help also
those price levels are clearly indicated on the JUNE graph

THERE IS A LOT TO LEARN-- GOT TO TAKE THE EMOTION OUT OF THE TRADE
and that can be done by USING FIBO math matched with squares as well as the PIVOTS
and EW precepts
ITS NOT HARD - JUST TEDIOUS and REQUIRES attention to detail.

Stay tuned for further updates
Better yet, JOIN The JAYWIZ VPN - GET MORE INFO with which to make BETTER TRADING DECISIONS- JOIN for 90days as a TRIAL- its ONLY $100-
THERE are MANY other analysts who write LONG Paragraphs 
about what happened yesterday, but only one sentence about what they think for tomorrow. JAYWIZ CONCENTRATES every bit of ENERGY ON TOMORROW.
 

Later
Jay


Market Timing-Whats Next-- AMAZING JAYWIZ POWER DATA


MCOS


THE GRAPH ON THE LEFT IS A PARTIAL of the POWER DATA which VPN members SEE for the WHOLE WEEK. gray line is my thinking & the black line is an OVERLAY from the Jaywiz ACTIVITY index. ITS OBVIOUS WE WERE ABLE TO SEE Monday's & Tuesday's action CONFIRMED by that activity index as updated daily- FOR THE DAY AHEAD.

MCOS is OBVIOUS-- Market has some CATCHING DOWN TO DO
More later
Jay

Sunday, May 26, 2013

Market Timing-Whats Next !! NO CRASH - BOO HOO

Thats RIGHT, JUST BECAUSE we had 14 days in a row with BEARISH PC ratios
and an INTERNAL TECH SELL SIGNAL does NOT mean an immediate demise for stocks.

WHATS THIS??_ JAYWIZ IS NOT A BEAR AND NOT CALLING FOR A CRASH !!!
HOLY Crap -- MAYBE IT REALLY IS TIME FOR A CRASH ???

HAHA- VERY FUNNY

FOR REAL NOW- CAN the SPX break into the 1700 realm & taking the Dow to 16,000 ??
AND WHEN will that be most likely to occur??
 
STAY TUNED TO FIND OUT !!! 

BUT FOR NOW, lets STAY GROUNDED and LOOK BACK at May 2013--
Here is the GRAPHIC projection that hundreds of you asked for the last two months-
of which MANY became VPN Members-- 

Members come from ALL OVER THE GLOBE, 
from Russia to London to Hong Kong and every where in between.
AMAZING place this internet thing-- brings us together as ONE --

NOTE that the GRAPH was first produced PRIOR TO May2013, and updated twice.
ALSO NOTE that the PEAK was expected on May15th actually occurred on MAY 22nd.
and did exceed the projected thinking of 1650, but not by much-1687.

THE ACTUAL high was 1412 trade days from October 10th 2007- 5 days after the intrday high
but the Dow did stay at the 14K level for a few more days after the 10th giving us a small range of days. GANN 67 tr days X 21 = 1407 which was the 15th.

ALSO NOTE that it also infers the time period AFTER a short term peak would NOT BE GREAT TO TRADE, at least not good for bears to trade. 
We have seen the mkt has held up quite well, even though we did get a 52pt SPX
decline and the dow fell from 15,542 to as low as 15,200, 
THUS FULFILLING my call for a 300 pt drop. 

WILL THERE BE MORE TO GET TO a 700 pt loss ??- STAY TUNED FOR UPDATES.
 
ONE OTHER THING that stands out - the BULLS are HOLDING ONTO their positive views and positions. EVEN THO, we may NOT SEE A CRASH in June, there is still a PROPENSITY for the market to make MID JUNE LOWS.

ENUF JIBBER JABBER- here's the graph.
JUNE projection is in the works and will be ready shortly.  


Later
Jay

Wednesday, May 22, 2013

Market Timing- Whats Next!! YIKES- 1687, now its TOO THE MOON

YEH RIGHT !!!
NOT SO FAST people !!!!

1687 is at a point where 2 waves are of EQUAL LENGTH
1648 to 1672 was 24 pts
1663 + 24 pts = 1687

NEXT STOP on the train is at 1600 Friday at or before noon
in DOW terms that = a drop of about 700 pts from today's highs.

IT HAS TAKEN a LITTLE LONGER and gotten a little HIGHER than my prior projections
BUT
A corrective wave NOW till May 3st WONT BE DENIED

YEH, Jay, YOUVE CRIED WOLF ONCE TOO MANY TIMES 
YES, its been a struggle to pick this peak, but EVERYTHING now seems to be in place.

WHAT ABOUT JUNE?
WELL
except for ONLY 3 days, the MONTH looks -------

Later
Jay

Friday, May 17, 2013

Market Timing-Whats Next!!- ADVANCE my FORECASTS ONE DAY FORWARD

THE LAST 2 postings

Thursday's projection for a TOP at 1665 

OBVIOUSLY move to TODAY Friday projection for a 
MINI CRASHETTE -MOVE TO MONDAY

& It may BE EVEN MORE THAN the 300 pts projected

AS OF TODAY, there will have been 10 days in a ROW WITH 80% to 100%
BEARISH PC ratios

ADD THE ABOVE
ON TOP OF THE TECHNICAL SELL SIGNAL  from WEDNESDAY'S close

and the VERY SERIOUS NEGATIVE ENERGY WAITING FOR MONDAY

ADD IT ALL UP AND WE ARE SET UP FOR ONE HELL OF A BAD DAY

IF YOUR BEARISH & YOU KNOW IT- CLAP YOUR HANDS
IF your bearish & You KNOW IT- STOMP YOUR FEET

IF YOUR bearish and you know IT,  SLEEP WELL THIS WEEKEND

LATER
Jay
 

Thursday, May 16, 2013

Market Timing-Whats Next !! ONE MORE DAY AT THE TOP of the HEAP

4pm update-
NOW THAT I CALLED THE MARKETS BLUFF TODAY< 
IT TURNED AT 2:15pm-- 
MANY TIMES I'VE SEEN 
THAT OCCUR AT VERY IMPORTANT TOPS
)))))))))))))))))))))))))))))))))))))))))))))))))))))))))))))))))))))))))
 
AFTER 2:55pm TODAY, the mkt should run up and close at 1660 to 1665

IT really MATTERS NOT WHERE it CLOSES tonight

BECAUSE
TOMORROW we can expect the 
DOW TO LOSE 300 pts
SPX to give back 40 pts
AAPl to see 422 if not even 411

IMPACT stream for 2mrw is just one indicator among others
16th on the graph represents the 17th for trading
EKG BELOW is also indicating a sell off

TECHNICAL SELL SIGNAL STILL STANDS AND GETS EVEN STRONGER

Later
Jay
ps- ive seen this in options week dozens of times- thsday stays in place and the real market wakes up on FRIDAY.


Wednesday, May 15, 2013

Market Timing- Whats Next !! TECHINCAL INTERNALS ISSUE SELL SIGNAL

TODAY IS MAY 15th and IF YOU NOTE that MY GRAPH POSTED previously ENDS on a  HIGH on MAY!5th- 

SURE, I tried to rush things little by calling for it as an ending yesterday, but the market had other ideas. 

THE JAYWIZ POWER DATA had some what I called SHADOW ENERGY TODAY that showed a possible UP DAY< and we got just that. IT EVEN EXCEEDED my well planned out high of spx 1656 by a few more points but came down rather swiftly from 1661.49. 

 just a note that the sum of the digits 1+6+6+1 adds to 14 which = 5 meaning CHANGE

I will gladly provide DATA to anyone who asks for it showing the TECHNICAL INTERNAL ARMS LEVELS that are related to SELL SIGNALS- 

 I HAVE 10 years of ARMS data to back up my claim.
 I can show you MANY PREVIOUS SELL and BUY SIGNALS with supporting DATA.

ON ANOTHER NOTE
Mahendra says the following
 ARE WE NOW OVER THE TOP??
MY judgment SAYS YES, and the MARKET is POISED to sell off.
keep in mind it goes down much faster than the time it takes to make gains

later
Jay

Tuesday, May 14, 2013

Market Timing- Whats NEXT !! JAYWIZ EKG & POWER DATA AHEAD of the game

STAY TUNED FOR FURTHER UPDATES
OR BETTER YET
JOIN THE JAYWIZ VPN & GET AHEAD of the MARKET 
HOW?
WATCH THIS

the POWER DATA gets sent out to the VPN GROUP on SUNDAY at 7pm which depicts MARKET ACTIVITY for the WHOLE WEEK TO FOLLOW.
 
Then the EKG for TOMORROW  is sent out at 8am & 7pm DAILY which shows us the NEXT DAY'S TRADING thus CONFIRMING the PD. 

THE DYNAMIC INDEX with all the color lines is also available
ONE DAY AHEAD of the market-- 

JAYWIZ RESOURCES ARE FORWARD LOOKING 
ONE DAY TO ONE WEEK AHEAD.  
PLUS as YOU ALREADY KNOW,  we also show a GRAPH for the MONTH AHEAD.

TOP left is the DAILY EKG
right is the POWER DATA for May13 & 14th
bottom is the DYNAMIC for 14th & 15th
remember that 13th on the graphs = 14th for trading, & so forth.

NOW YOU CAN PLAINLY SEE why 
SO MANY TRADERS ARE JOINING the Jaywiz VPN
WHAT ARE YOU WAITING FOR??  
PROCRASTINATING OVER $100-- REALLY ??

Ive even had people join who are not traders, & some are beginners, but most are active traders.
HUGE improvements have been made int he last 6 months allowing more precise analsys
DONT WAIT ANY LONGER to JOIN or RENEW - 
WE ARE AT A VERY IMPORTANT PRECIPICE in time.


Later
Jay


Market Timing-Whats Next!! -Finish line in SIGHT

TWO graphs below both ending on May15th with the potential of a REAL TOP at 1640 to 1650.

THE FIRST edition was sent out in APRIL and 2 UPDATES were edited on
MAY3rd in BLUE
May11th in RED

THE MOST IMPORTANT  feature of this graph is POINTING OUT the FINAL AND last HIGH
of the LONG BULL market from March 9, 09 to May 14th, 2013.

WHY MAY 14th and NOT the 15th? You ask.  good question
my original analysis  pin pointed the 15th, but the DAILY READINGS BELOW infers the 14th
IN ADDITION, the LATEST POWER DATA graph also points at TODAY as THE DAY.

CYCLE DATA
The 15th represents 55 + 67 GANN trade days from the Nov 16th pivot low at 1343
The 15th represents 67 trade days X 19 segments + 110 tr days from the OCT10, 2007 TOP

MAY14th- Todays READING calls for
SWIFT ACCOMPLISHMENTS

May15th reading calls for
A POOR SOCIAL DAY AND ONE THAT expects REAL LIFE AUSTERITY

Thsday is UNPREDICTABLE - not a good trading day for bulls
FRIDAY - expect disorientation - not a good trading day for bulls

Also be prepared for a tough weekend may 18-19

WANT TO SEE THE REST OF MAY?? Just ask me for it by EMAIL - its free
or better yet, JOIN THE JAYWIZ VPN - thats not free, but packed with lots of INFO ABOUT WHATS NEXT. 

MANY ANALYSTS write a lot of  paragraphs aboout HOW WE GOT WHERE we are, but OFFER VERY LITTLE as to whats next; OR ITS MAYBE THIS AND MAYBE THAT-- WELL THATS NOT JAYWIZ - decisive and discriminate data that YOU as a trader can use to help you make better trading decisions.

stay tuned for further updates
Jay


Friday, May 03, 2013

Market Timing- Whats Next -- MAY PROJECTION now available

the PIVOT mentioned above for May 3rd came on MAY1st and we NOW are over 1600 long before May15th   .. SO, what does that mean for MAY 15th ? and beyond ??

ITS ALL NOW AVAILABLE in the MAY 2013 projection.

The FREE PROJECTION FOR MARCH worked out well, but we skipped April.

ANYONE who requested MARCH, also just got MAY 2013-- 
SO HOW DO YOU GET the JAYWIZ MAY 2013 GRAPH ??

*****SIMPLE;- JUST send me an EMAIL REQUEST********

I do NOT sell email addresses 
NOR will I PESTER you with tons of emails.

Just an occasional update during the month, and who knows, maybe you will do well with it, and JOIN the Jaywiz VPN as MANY have already done since the March projection.

FIND OUT NOW if MAY 2013 will bring a CRASH OR HIGHER HIGH, and WHEN to expect either event.

THE DAILY EKG , weekly PD & other RESOURCES continue to provide data that traders use to stay ahead of the market-- 
SIMPLY use Jaywiz data in conjunction with your own work to give you that extra edge when making trading decisions-

STAY TUNED FOR FURTHER UPDATES
Jay

Monday, April 29, 2013

Market Timing-Whats Next !! READ ALL ABOUT IT- THIS may be good POLITICALLY, but

I DOUBT THIS WILL SIT WELL WITH THE FINANCIAL COMMUNITY

WATCH OUT MR WALL ST *****
The TIMES - they are a changin****

STAY TUNED FOR FURTHER UPDATES
Jay


Tuesday, April 23, 2013

Market Timing -Whats Next !! COME SEE WHAT YOUR MISSING OUT ON

JAYWIZ DAILY EKG on TOP LEFT was EMAILED to the VPN GROUP on Monday at 7PM
UP till noon:30 ---  MINI FLASH CRASH at 1:15 then back up into closing high @ 1579

JAYWIZ POWER DATA was SENT OUT on SUNDAY at 7pm -thus we had a MAJOR HEADS UP on what COULD HAPPEN today, WELL IN ADVANCE--  THAT'S NOT one step ahead-
ITS MORE LIKE THREE steps AHEAD.

 HOW MANY ANALYSTS SHOWED YOU the POTENTIAL for a MINI FLASH CRASH TODAY, and ALMOST PINPOINTED THE EXACT TIME OF DAY.

A 180bar PIVOT was DUE just about the SAME TIME, confirming the dip

WHAT THE ^#*#*^ are YOU waiting for-- SEE DC BEAR's COMMENTS-
and HE MAKES MONEY ON THE BULLISH SIDE, using my RESOURCES.

STAY TUNED FOR FURTHER UPDATES
and
YES - JOIN THE JAYWIZ VPN TO GET 3 steps ahead.
Jay

Wouldn't YOU like to know what to expect the rest of this week??
Of course you do- IT ONLY TAKES A VERY SMALL fee of $100/90days

THERE ARE MANY OTHER services that charge as much as $100/ month
and dont offer forward analysis anywhere near what you will get at Jaywiz.


Thursday, April 18, 2013

Market Timing -Whats Next- The MORNING REPORT and REVIEW


VPN- EMAIL FROM April 17th @ 8am

Higher open completes and ABC to 1556-1559
32 pts on last drop
32 X 38%= 12 , got to 1555
50% = 1559 could complete the upleg or somewhere in between 1555 & 59
THEN expect a drop to try and break under 1540 as late as 204b @ 1;30 and or 228b@ 3:30 today

BUMP UP AGAIN from there--just do the math at that time

THEN LOOKS like FRIDAY"S low between 11am & 12;30 makes the main pivot
as far as we can tell- will update the EKG later today-4pm to see all of 2mrw

later
Jay

WACO -- ANOTHER notch in the INFAMOUS WEEK of April 19th - wow- IMV, that had to be sabotage??


HERE IS THE EKG FROM TODAY WITH DETAIL & TODAY"S TRADING NUMBERS
NOTE HOW WELL IT CORRELATED for the 16th & 17th and NOTE 2mrw's EKG in ADVANCE - 
Just to give you something to watch for


 Yesterday's report gave out price parameters as low as 1500 by Friday, which is still possible but unlikely. EW precepts indicated potential for a low at 1530. I GUESS there are SOME OF YOU OUT THERE WHO would tell me-- OOOHHH JAY, YOU SCREEWED UP
YOU TOLD US 1500 was going to be a LOW, and YOU TOLD US that 3:30 would be THE LOD.
 THE VPN group were told to look for 1530 AS POTENTIAL- WHEN WE THROW OUT PRICE LEVELS  - IT IS NOT CUT IN STONE- those are only potential price levels, and OMG, I WAS OFF by 30 minutes to the EXACT LOW OF THE DAY  - CAN YOUR SYSTEMS DO THAT??

I guess those of you who are like the above are REALLY NOT traders, and have NO IDEA how to make projections IN TIME and or PRICE - YOU JUST WANT Some one to blame for your
cruddy trading habits. well SO be it- have it your way and we will all be very happy.

BUT for those of you who want to AUGMENT their OWN trading methods, MY SYSTEM WORKS EXTREMELY well as IVE posted MANY testimonials from my clients over the past few years. Some of my 90 day memebers have signed for ONE FULL YEAR, and others for 6 months.
THEY KNOW HOW TO MAKE MONEY using MY SYSTEMS.

STAY TUNED for FURTHER UPDATES
Jay


Wednesday, April 17, 2013

Market Timing-Whats NEXT ! -- HERE IS WHAT YOU HAVE MISSED OUT ON

POWER DATA now INDICATES A SHORT TERM BOTTOM on the 19th
MANY Nasty events occur on or about the 19th and we already witnessed the Boston Marathon
(ps, MANY MANY MOONS AGO, I was one of those national guard troops assisting at the Marathon on Patriots day)

CAUTION IS WARRANTED AS WE SEE that TURN possible mid day on the 19th
18th is an 8DAY LOW
19th is an 8day TURN
IN ADDITION-- FRIDAY IS A 13day PIVOT LOW at 11am  - can extend to noon
AND 258bars is at 11;30am - can also extend up to one hour
NEG E until 12:29pm
LOOK BACK AT THE 12th-- HALF DAY DOWN TILL 11am then up modestly to break even on the Dow

JAYWIZ PROPRIETARY ADV/Decl & VOl indexes are at 311 & 387, BOTH UNDER 400 ~~WHICH is indicating we are approaching an oversold condition
BETTER TRIN = 42.87 BLUE-- a BUY SIGNAL or at least a GET READY signal
trin 5 @ 707
trin 20 @ 195
trin 10 @ 1135
all indicating we are GETTING oversold

THE WAVE looks like an ABC off the 1597 top to 1552 = 45 pts
50% retrace back up to 1574
NOW an ABC @ 1.62X 45 = 73 to 1502, probably on FRIDAY
and that fits well with the PD, DYN , IMPACT ACTIV & EKG-- its WONDERFUL when they ALL SING THE SAME TUNE--
Most of that decline would most likely occur 2mrw- THERE IS NO OTHER TIME THAT IT CAN - so _ would expect
2mrw to provide at least 78% of the 73 pts drop =about 55 pts ~ then leaving 18 pts for Friday to touch near 1500 as indicated above.
Later
Jay


ALL THE JAYWIZ RESOURCES ARE ONE DAY AHEAD
which simply means
THEY SHOW US TOMORROW'S MARKET TODAY 
17th - EKG got published at 7PM on the 16th 
18th EKG == DITTO - its now 7pm on the 17th.

IF YOU WANT THIS KIND OF FORWARD projections
then all you have to do is JOIN THE JAYWIZ VPN
I dont know what the ^#*^ you are waiting for-
IVE PROVEN TIME & TIME AGAIN how valuable 
these resources are - 
yeh, I know YOUR HARD TO CONVINCE
SO BE IT- MAKE IT SO, said the cptn.    
 

ACTIVITY INDEX

IMPACT

DYNAMIC INDEX

Tuesday, April 16, 2013

Market Timing-Whats Next !! WHO IS ON SHAKY GROUND

IF YOU THOUGHT you were standing on SOLID GROUND, BETTER TAKE A GOOD LOOK

APRIL 18 to 22 has been OUTLINED by ERIK HADIK at his website -top of the page link

See THIS below AND A LOT MORE !!

APRIL 18 to 22 has HUGE HISTORICAL SIGNIFICANCE  -& ITS NOT PRETTY !!
Hitler was born on April20th , but go there to see it all for yourselves.


Monday, April 15, 2013

Market Timing-Whats Next !! GET INTO CASH

WHATS THAT!!_ YOUR STILL NOT CONVINCED!!
OK< its YOUR MONEY- Its been reported that Mutual Funds now moving into cash.
We certainly can tell that CENTRAL BANKS are DUMPING GOLD to get CASH.


MY timing model shows me the FIRST PIVOT LOW this week of any consequence should occur on Thursday morning possibly at open.  

POWER DATA this WEEK hugging the BASE LINE near its lowest magnitude
EKG showing no strength
DYNAMIC index ROLLED OVER on SUNDAY and is heading lower
FLUX heading decidedly lower
And There's LOST MORE TO SHOW YOU !!

WHERE IS GOLD HEADING AND HOW LONG WILL IT TAKE TO GET THERE ??
WHERE are STOCKS HEADING AND HOW LONG WILL IT TAKE TO GET THERE??
IS this the START of a LONG awaited & PROLONGED selling period?? 

GET ALL THE ANSWERS TO THE ABOVE and lots more.
JOIN THE JAYWIZ VPN and get ahead of the market.

Jay
SO YOU Thought science had discovered everything that they need to know -HAHA
heres an article in this weeks TIME MAG
There's a LOT more going on around us & throughout the
UNIVERSE that effects the way we think & behave

ONE day, maybe they will be able to measure such things,
and determine why we do what we do and when we do it, BUT FOR NOW,
all you need to DO is JOIN THE JAYWIZ VPN


Sunday, April 14, 2013

Market Timing-Whats Next!!-- TEETERING at the EGDE

1. ON TOP  --  DANERICS LONG EW for GOLD
 MY WORK SUGGESTS 1448 and or 1383 are FIBO levels to look for in the near term.

2. Columbia's COPPER verses SPX-- DUHH --self explanatory
SPX just waiting for the other shoe to fall.

3. Columbia's MCOS graph now dropping back to the ZERO LINE
note also the recent NEW SPX HIGH brot in a LOWER mcos HIGH dropping successively 
since Jan 2013 , and July 2011.

4. Columbia's ROC graph with MY BLACK OUTLINES ARROWS Comparing previous VULNERABLE times past of August 2008 & July 2011.


HOW LONG ARE YOU GOING TO IGNORE the WARNING SIGNS ??
 
Stay Tuned for Further Updates 
Jay


Friday, April 12, 2013

Market Timing -Whats Next !! EW graph & parameters

SORRY for the SILENCE last 2 days- have been dealing with a diagnosis of prostate cancer
and will have to undergo 8 weeks of radiation treatments. IT is 99% curable, but it will be traumatic for me over the next 2 to 6 months.

The recovery off the APR5th BRADLEY PIVOT low regained MORE than the 78% as thuoght possible and took a day or 2 longer than anticipated, but IT DOES LOOK like 1600 is a lost thought for now.

THE WAVE from the 1597 high appears to have morphed into 5 waves to 1579 @WAVE (1), thus allowing a recovery in wave (2) to as much as 78% to 1593-

Stay tuned for further updates


 NOTE HOW WELL the EKG LEAD the SPX path this week
Later
Jay


Sunday, April 07, 2013

Market Timing-Whats Next-- GO ON people -HOLD onto those BULL HORNS- but dont get GORED!!

TAKE A GOOD LOOK AT LAST WEEK"S POWER DATA
HOW much $$ could you have made 
having this in your back pocket? 

The POWER DATA gets published to the VPN GROUP on SUNDAY at 7pm, and or Monday at 8am, which gives us a view of what to expect the WHOLE NEXT WEEK.


Thursday, April 04, 2013

Market Timing-Whats Next !! A TECHNICAL WARNING from JULY2011, now DUPLICATED as of APRIL2nd

Jaywiz INDEX ABOVE- SECOND COLUMN is the 10day AVERAGE similar to a TRIN FROM JULY5th to JULY27th, 2011

 COMPARE to the SAME TECHNICAL DATA BELOW 
for 
March 5th 2013 TO APRIL 2nd,2013-- 

THE JULY 2011 index is HISTORY and what followed was a 2000 point drop in the Dow 
NOW_IT IS DUPLICATING the JULY 2011 scenario, 
indicating 
A MAJOR DROP ABOUT TO OCCUR- APRIL 2013

SEE THE HEADING AT THE TOP OF THE MAIN PAGE - ITS BEEN UP THERE ALL OF MARCH - 
its that time again
PROTECT YOUR PORTFOLIO !!
Jay

Wednesday, April 03, 2013

Market Timing-Whats Next- THINGS YOUR BROKER WONT TELL YOU

TODAY'S DECLINE was IMPULSIVE !!
whats that mean, you ask ??
SIMPLE
THE BULL RUN IS OVER
APRIL , as projected will be the FIRST KINK in the BULL"S ARMOR 

CNBC has been telling everyone just HOW RESILIENT the stock market is,
BUT
What about 2mrw ?? what about it 

What did we get from the 1573 HIGH Today to 1550 other than 23 pts ?
Why did it occur ?
HOW did it UNFOLD ?
What does that tell us about 2mrw ??
WHAT ABOUT NEXT WEEK ?
WHAT ABOUT the week after ?

EVERYONE WHO GOT MY 3 month PROJECTION now sees just how neat the swing fell into place, and everyone who only got March, should have joined the VPN to get ahead of the trend.

LOOK AT THE TOP OF THE MAIN PAGE !!

YOU DONT WANT TO Believe it -OK,, SO DONT- its YOUR MONEY!!

PROTECT YOUR PORTFOLIO !!
when was the last time I posted that DIRE warning??
IT WAS Late  JUNE , EARLY JULY of 2012-


I have the STATS to MATCH the last 5 days with the above warning
want to see it- just email me
PS- All previous MARCH requests will be automatically sent that ARMS DATA chart 2mrw  -

PS- Ive got 10 years of ARMS DATA for reference, and occasionally it comes in handy. 

Later
Jay


Market Timing- Whats Next!! Waiting for the Inevitable is PURE TORTURE

WE ARE ALL expecting the BEAR TO TAKE OVER, but  ""WHEN"" has become more elusive than my previous projections inferred.
THUS in review of what I wrote on the previous message , I AM ADJUSTING MY THOUGHTS TO CONCUR with what we see and some possible projection inversions JUST FOR THIS WEEK.
THE PD infers the 4th as an intraday high THEN the 5th, a BRADLEY date- The turn lower, not a LOW-pivot as previously indicated.


RIGHT NOW TODAY- April 3rd & 4th
IF the SPX does NOT HEAD LOWER breaking under 1558 and HOLDS nearer to 1570, then A LOOK at the PD depicts the 4th will OFFER ONE MORE ATTEMPT to touch those magic levels.


FAILURE to achieve and break OVER 1575, should have its effects On the afternoon of 4th and the afternoon of the 5th-- 


SUMMARIZE __The 4th ENDS the RUN  
The5th BRADLEY starts the DOWNTREND in EARNEST - 
A DOWN FRIDAY generally leads to a down Monday, and in this case a lower open on the 9th.

THE 10th MIGHT ONLY OFFER A ONE DAY REPRIEVE as this DOWNTURN is STILL GOING TO BE QUITE DEEP AS PREVIOUSLY PROJECTED
Thus, My game plan will be to BUY MORE SHORTS On the 4th at any rally from 1575 - 1583, and WAIT FOR THE HAMMER TO DROP on the 5th, and it wont be obvious that something is wrong until the8th or possibly even after the 10th.


CONFIRMATIONS of a SERIOUS TURN ABOUT TO OCCUR
 CHOOSE TO SEE WHAT YOU WANT- BUT DO BEWARE
PROTECT YOUR PORTFOLIO -- NOW !!
stay tuned for further updates
Jay 

Tuesday, April 02, 2013

Market Timing-Whats Next-- YOU CAN ACHIEVE GREAT RESULTS ALSO

Cheers Jay, nice work...  Made a large short the other day and managed to pull some decent money from the markets if they kept going down it would have been a very large profit i gave it as much of a chance as i could but made sure that i take a profit, also dow bounced off the 61.8 fib from high to low making an accurate shorting zone, After i also felt the market was going up so mentally stopped it out, still made 15K total that day, account now today at 94k from 10k in just over 2 weeks, unreal when you think about it. 

regards
John
4/2/13