THE NEW JAYWIZ 2023

THE NEW JAYWIZ 2023
THE NEW JAYWIZ 2023

Monday, January 10, 2011

Market Timing-Whats Next -Jan11th closing update

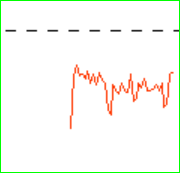
IMPACT stream showing STRENGTH THIS AM
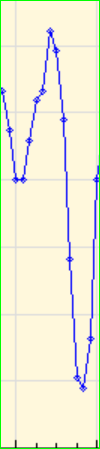
Upper graph showing WEAKENING @ 2pm 


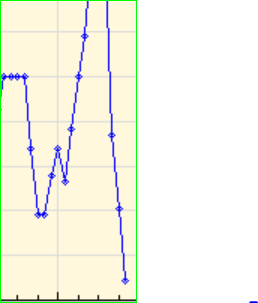
LOOKS LIKE TOMORROW will conform with FUTURES trader call for afternoon dump

258Bars @ 10am
39 hours at 10am
60bars at 3pm - could be lod
Negative energy at 3;37 pm could extend that lod to that point.

*****************************
Jan 2011 seem to equate on an 11 year sunspot cycle BACK to YR2000
there was a MID Jan high which led to a 2.5 year decline.

AND even more coincidentally there was a SMACK down in APRIL 2000 which I had expected LAST year, but it never materialized. HOWEVER, this year I have the ENERGY EVIDENCE that
marks it VERY CLEARLY for LATE March MATCHING the 1940-1942 chart.

THAT cycle would project a major LOW in Jan /Feb 2012, then mostly up for 2012, but a secondary
low in first qtr of 2013 - IM working on the details of that and will comment more later.

Jay
EKG IS BATTING 1000 this month so far

Sunday, January 09, 2011

Market Timing-Whats Next -Jan10th closing update

AS WE CAN EASILY SEE, the AFTERNOON LOW AT 2Pm was not in keeping with the DEPICTION of the EKG


Add caption
IMPACT stream showing us the SAME weakness this morning


BAR CYCLE PIVOTS today
180bars at 10am could be the lod
204b@ noon
228bars at 2pm

258 bars at 10:00am on Tues which is also RIGHT ON the 39 hour cycle
which makes 60 bars hit 5 hours later @ 3pm.


THIS Weeks readings
 
Monday
Enthusiasm & favorable, but he futures this am dont look that way, but WHOLE day is not predicated
on 8:30 am futures.
Monday Night = unsettling news- DARN, you mean there's more that what we already got??

EXPECT DISRUPTIONS & SUDDEN CHANGES MONDAY NIGHT effecting Tuesday

Tuesday-
Keep low profile
NO New projects

WEd
Early mis -communications
stressful & exaggerated distortions

THS
WELCOME changes
optimism

Friday
Navigate tricky waters
obstacles & annoyances
Harmony by days end


**
TUESDAY'S POWER data SHOWS a big sell off could OCCUR agreeing with the above
energy forecast & so far the early EKG also AGREES
Jay

Getting used to this new format 
the ACTUAL low at 2pm was at 228BARS but NO where near as low as the EKG showed it, and Ive warned about this many times that can happen-{ I have NO control over it }- IT DID however, show the PIVOT low at 2pm which then allowed a little upward motion AFTER that pivot.
Jay

Market Timing-Whats Next -Jan10th POWER DATA

Jay

Market Timing-Whats Next- 1st Qtr -2011 projection

RE published again for referral
Jay

Market Timing-Whats Next- Jan 2011 projection

Just because this chart depicts energy flow for  Jan 2011, {typo above} doesnt mean the market will follow it exactly, but just like the EKG & Power data, it should be within 70% of what we see above.

IT would appear we might have ONE MORE SHOT at break above 1278, but FAILURE is IMMINENT, and the INFAMOUS "C" wave has begun- PROOF of which should occur this coming week, from Tuesday to Friday as above.

Refer to the chart of 1940 to 1942, - previous page
at which point we are at the far left about to enter the twilight zone , aka WAVE "C"

WE will now see the BEARS Screaming crash quite often, but the graph I published shows ONE event this year as of Late March, and the est of it is normal ebb & flow.

Later this year, after June or July we should then get another sell off similar to 2009 ending Jan/feb 2012, but the after effects could linger for another year till 2013 unlike the rebound of 2009-2010.

Jay

Friday, January 07, 2011

Jan 2011 to March 28th, 2011 & beyond

Im going to publish this weekly until im proven wrong

Jay
We are on the FAR left of this chart as of Jan 2011

Market Timing-Whats Next -Jan7th closing report

DAILY EKG RIGHT ON TARGET TODAY AS USUAL
A closer look at the impact stream does seem to show weakness developing
Jay -9:15am

AS I Mentioned Yesterday, the Employ data this AM would NOT light Wall st on fire today
BUT the IMPACT stream seems to say there is still some strength in the market
One MORE BUT- the POWER data does NOT support a new high NOR does the EKG
Activity index was 100 earlier, now at 400 at 9am

126bars at noon

more later

MORE NOW
126 bars hit a little late at 12:45 , but still within normal limits
Activity index was at 400 at 9am, now at 200 since about noon
Jay
DAILY EKG - I dont know HOW anyone can day trade without this GUIDE
 

Wednesday, January 05, 2011

Market Timing-Whats Next -Jan6th PM Report


IT DOESNT GET ANY BETTER- WHERE are YOU DAY TRADERS - must be sleeping instead of trading??????? Jay


8:25am -UPDATED AM, prior to Employ report shows potential for early bounce, but later drop off
as the TOP graph shows
Activity index a little bouncy, but in a very narrow range between 100 @ 200
FLUX has been VERY HEAVY NOW EVERY DAY since Dec27th- IT was like that every day in 2009 till March 13th. Something is brewing, but we might not see any effect till March,imo.


Jan 6th looks promising for a moderate selling day
Power data agrees with the above
90Bars @ 3;30 might be the lod


Tomrrows EARLY energy at 9am seems to indicate the JOBS report will NOT be what WallSt was
expecting.

Jay

Market Timing-Whats Next -Jan5th PM report

WE can see strength this afternoon from the above

IMPACT stream in RED on top is pulsing UNDER the dotted line indicating weakness
matching the LOWER futures this AM
& matching the EKG which indicates a low mid to late day.
258bars at 2;30pm might be the lod

The POWER DATA graph previously published agrees with a low today,
 but next 2 days are showing strength , but the energy outlook shows a low due Friday AM

more later
Jay

At noon, the mkt is responding well to the above graphs as it seems a recovery from the AM open low at 13hours is in progress- the POWER data seems to think there wont be another low today, but we will have to wait to see if that one agrees.
Activity index at NOON HAS DROPPED FROM 233 to 100 and there can be as much as a 90 minute delay leading to the 258b pivot at 2:30, which does NOT have to be the lod, but should offer a level
lower than where we are right now
Jay

PM
INTRADAY direction once again was quite precise, but the day ended near its highs
So far HOLDING JUST UNDER that threashold of 1278 = 9
 9 in numerology is a number that indicates completion
Weve seen tops at 9's and sometimes at 5's which indicate CHANGE

Jay

Tuesday, January 04, 2011

Market Timing-Whats Next -Jan4th PM update


As we can SEE from the IMPACT stream above, the ENERGY pattern is in WANING MODE
and the mkt is dropping from the open highs. THE HIGH ENERGY pattern ended at 8:40 AM.
THE POWER GRAPH also shows the same for today, and a possible low pivot tomrrow agreeing with the Alphie chart. -
180bars @ 2:30
Commodities selling off today - CNBC wants to know why- guess they thought it would go UP forever- well we all know what happens when the majority think that way.
Jay @ 1pm


TODAY'S BIAS is still to the upside as of PRE open
Jay

Monday, January 03, 2011

Jan 2011 - Feb 2012

WE ARE AT THE FAR LEFT CORNER as of Jan 3rd, 2011

Jay

Alphie - Jan 2011

SEEMS to fit well with my studies of energy for January
Dont expect anything major, and just like some of my charts, the swings might be very muted
where the charts show large swings.

Some people are expecting large moves, but the energy for such, IMO, still has time before
we see anything important, but IT CAN SNEAK right up on us without warning.

Jay

Traders Power Graph this week

Much Strength with HIGH ENERGY effecting today's market and part of tomrrow

Floating along at current levels 1278 = 9

At 3;30 dropped back a bit

Impact stream flat

Activity index holding at 200-233

204bars at 3:30 might offer a closing lift

Jay

Market Timing-Whats Next -Jan3rd PM report

SEE it for yourself
SHOULD I DUMP the EKG ??

Looks like an OPENING SPIKE but selling into mid day then another attempt later

Favorable influences this week should keep the rally floating higher

Mid day power struggles

Activity index earlier at 233, now at 133

90bars at 1:30pm

39hrs at 10am could offer the hod

more later
Jay

Sunday, January 02, 2011

Potential Path Till March 28th


530 tr days above is a TYPO- not Oct6th
HOWEVER, the correct previous date is MARCH 6th, 2009
so there is a good time correlation to a previous important pivot
Jay

Saturday, January 01, 2011

CRASH IN 2011- YES OR NO

HAPPY NEW YEAR TO ALL

WILL THERE BE A CRASH IN 2011??
And
WHEN will be the MOST LIKELY Time for it to occur??
LETS DISCUSS it


Jay

Friday, December 31, 2010

Market Timing-Whats Next - Dec31st -PM Report

ANOTHER NEAR PERFECT SCORE
Where the HELL are ALL the DAY TRADERS **********
they should be JUMPING ALL OVER this daily report*********
Very rarely is it DEAD WRONG and at 70%, it has a remarkable 10 month record
Jay
Could be a late sell off which also agrees with the POWER Data showing weakness Yesterday
continuing into today, but dont expect anything unusual. Im pact below shows weakness in the AM as also indicated by the AM futures.
Jay

Wednesday, December 29, 2010

Market Timing-Whats Next - Dec30th -PM Update

ONCE AGAIN still at 70% accuracy daily since MARCH 24th
we see JUST HOW WELL the EKG depicts in ADVANCE what the market will do today
Jay
We can SEE from the IMPACT stream, WHY we are selling off{{ AT 10:30am }} a little more than we have seen for a while.
It also CONFIRMS the POWER DATA projection for a lower day today & tomrow
and gains more evidence for a short term low on Jan 3rd.
possible lows for today could occur at 12:30 @ 180 bars
Tomrrow lows Also at 12:30, and again at 2:30pm
BUT dont expect anything major
Jay

Jay

Tuesday, December 28, 2010

Market Timing-Whats Next - Dec29th -PM update

Certainly does resemble the EKG
STILL at 70% for DAILY accuracy since March 24th if this year
Jay
STILL STEADY AS SHE GOES
Jay
Tomrrows outlook calls for frustrations, Stress & demands
26 hrs at 10am
Neg energy at 10:30am
90bars at 11;30
take yur pick

MORE NOW
I really think that 1260 will remain the CEILING and we will start to deteriorate VERY SLOWLY from there and HOLD this NARROW range and current levels till MID MARCH

IT IS POSSIBLE we just might get a very serious crash wave, but NOT until the last 2 weeks of MARCH

I will follow up on this scenario in more detail as the new year begins

best wishes to ALL for 2011

Jay

Monday, December 27, 2010

Market Timing-Whats Next - Dec28th -PM-Report

Once again the end of the day could have been deeper, but direction counts more than amplitude, so, an end of day drop off did occur, and more is expected tomrrow
Jay
The IMPACT stream clearly shows the higher open and subsequent drop
Todays POWER data shows the day weaker, leading to a low tomrrow Am before rebounding
Jay