THE NEW JAYWIZ 2023

THE NEW JAYWIZ 2023
THE NEW JAYWIZ 2023

Tuesday, July 19, 2011

Market Timing-Whats Next -JULY 19th Closing UPDATE

ONCE THAT LONG TREND LINE BREAKS< WE WILL KNOW THE BULL TREND IS OVER 
 And IT could come as soon as September-
ITS VERY EASY TO SEE THE H&D BUILDING

Best Wishes
Jay
note that VPN Members got this graph on Sunday

PC ratios that were 80% Bullish yesterday
ARE NOW
80% Bearish
and Jaywiz index = .29 very bearish

However, there should be one heck of a recovery from the AM lows
topping off on THSDAY AM

ITS A CHOPPY WEEK WITH WILD GYRATIONS
Typical of a triangle building within a SHORT TIME PERIOD & Small price range
Everything gets magnified immensley

Tomrrow is 55 tr days May 2nd , so we should see another high, but it wont be a major turn
More Later
Jay

Market Timing-Whats Next -JULY 19th morning update

1326 looks possible for 2;30 to 3pm today


The SPX made it to 1320 at 11am, and backed off to 1314 at noon
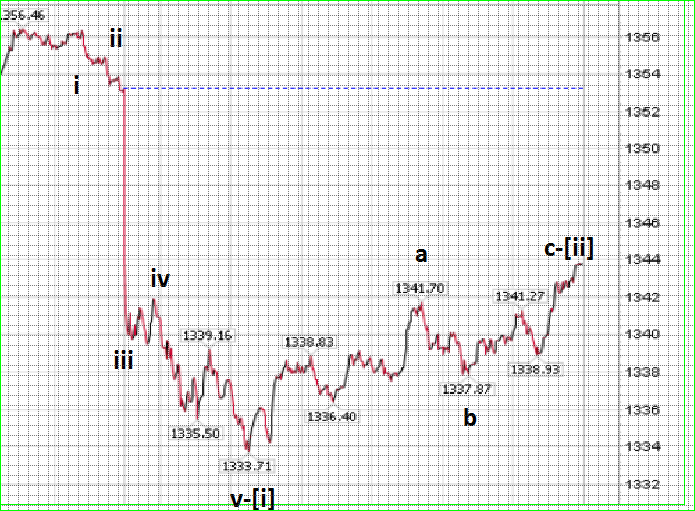
that low at noon could be labeled as [iv], thus [v] is still out there between 2:30 to 3pm today

After a mid afternoon high today, the POWER DATA index shows a SHARP drop
into tomrrow AM making a low between 10:00 to 11:00am

From there , a strong recovery could get right back to 1326 at close or open on Thsday

1356-1296= 60 pts
60X 50% = 30 + 1296= 1326
60X62% = 37+ 1296= 1333


THe low at 1296 closed out in 5 waves from 1356 on July7th
IS that the WHOLE wave 4 correction?
Do they run now to 1381 or is there too much uncertainty until the debt ceiling problem is resolved?
IF so, then the 4th wave continues in very choppy fashion until the end of the month.

more later
Jay

Market Timing-Whats Next -JULY 19th Closing REPORT

July19@ 7:45am

yesterday was 666 March 9th, 2009
258bars pivot due at 11am hit at noon

Today calls for TEAMWORK , optimistic & favorable
BUT it changes LATE afternoon - stress & anger

1356-60=1296 as previously projected
60X 62% = 37 + 1296 = 1333 , but I doubt that will be today
It looks like yesterday may have completed an "A" of 4wave
which should give the mkt a chance to reach 1333
at sometime within the next few days in wv 'b' of B

more later
Jay
 more now, @4pm
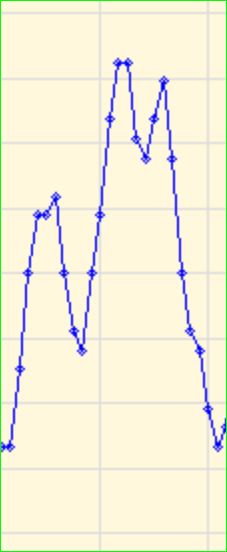
P/D indicates a MUCH LOWER OPEN TOMORROW- WED Jly20
Many times, when the EKG shows selling at close, it can spill over to the following AM
AS it is, the EKG for jly20 DOES Show potential for lower open.

TElling the Public they are closer to a deal is NUTS
all they have is a new proposal
 which will never pass in the House
Jay

Monday, July 18, 2011

Market Timing-Whats Next -July 18th - Closing Report

JULY 18th @ 8:45 am
Jay
A lower open needs to HOLD--1306
and offers a short term Buy
Friday's closing rally looks like it was 5 wves OFf the 2:30 TURN
 IF 1298.61 was WAVE 1 of 5
& wave 3 was @ 1356 on July7,
then wave 4 IS STILL IN PROGRESS within 1306 to 1338.
UNLESS it breaks UNDER that 1298.61
__________
Even then IT could be forming an EDT as long as 1298.61 isnt smashed
by a large margin

I would think that holding 1306 level is the first Key to the above puzzle


Today's 258bars DUE at 11am could truncate to 10:30
since the late turn Fridy DUE @ 3:30-228bars was an also hour early@ 2:30


And 26 HOURS is due at 10am

CHOPPY trading this week between 1306 & 1338
makes for great DAY TRADING ONLY till August 2nd completion at wave E @ 1288

Sunday, July 17, 2011

Market Timing-Whats Next -JULY 18th Weekend WAVE projection

July 17th @ 8pm

Lets see if this can hold water
This update SUPERCEDES all preceding projections
Jay

Saturday, July 16, 2011

Market Timing-Whats Next -JULY 11-15- Week In Review


THIS WAS LAST WEEKS ADVANCE VPN REPORT 
 psych reads & energy & bar cycle pivots

Psych reads
Monday
investments are in doubt

126bars  @ 11:30
156b @ 2pm
180b @ 4pm OR OPEN onTues

Neg energy at
11:23
12:47
+ energy at 1:40 & 3:55pm

MIDNITE LOW TIDE
_________________
12th-Tuesday
heated emotions early
better mid day
impatience later

39hours at 10am or sooner given
180 bars possible at open or at least within the first 10 minutes

78.6% /13 day cycle at 12:25pm

204B @ 11:30
228B @ 1:30
258B @ 4pm and or open Wed

Neg energy at
3;36 AM which could have an effect on Tues close
and or Wed open converging with the 258B cycle pivot
THIS COULD also effect EUROPEAN mkts open at 3pm EST.
&
8am
4:53pm & 7:39pm
+ energy at =8:21am

_________________
13th -Wed
$$issues & tension today
mixed emotions
67 tr days cycle from Apr6th hi

30bars @ noon
60bars @ 2:30

+ energy at 11:08 & 1:30
- energy at 11:47, 6:20 & 8:30pm
__________________________
14th-Thsday
anxieties - fears - obstacles
DAY GETS WORSE AS IT PROGRESSES
A Bradley date
13 hrs at 10am

90B @ 10:30
120b @ 1pm
150b @ 3:30 or 156B @ 4pm

14th & 15 are tidal CIT's -

- energy at 6:20 ; 8:56 ; 84:09 & 7:10PM
+ 1:59 pm
UNRULY and or Militaristic overtones
___________________________
15th- Friday
666 tr days Nov 20th, 2008
Foll moon @ 3am following Eclipse from JULY 1st
Puetz window closes today
**13 day cycle today AT 11am - the same one that I first found on NOV 21st

156b @ open if it did not effect previous close
180B @ 11:30
204B @ 1:30
228B @ 3pm

NO ENERGY EFFECTS DURING THe trading DAY
+ energy at 5:22pm
- energy at 7:52pm

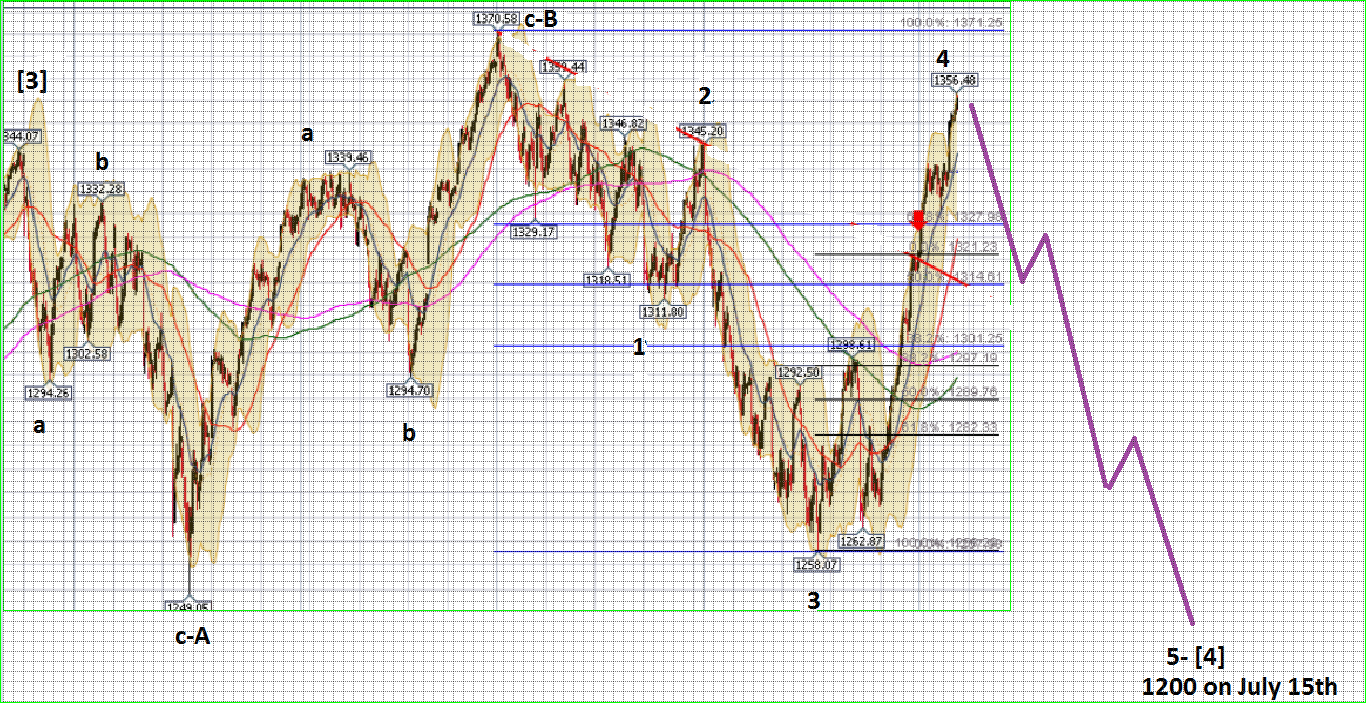
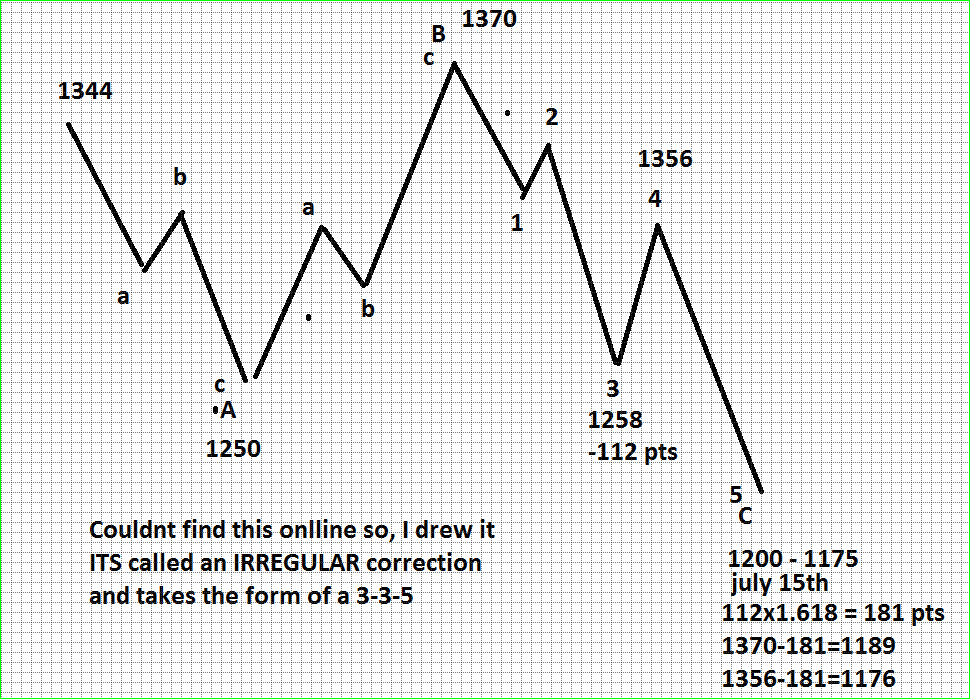
Market Timing-Whats Next -JULY 15th WAVE REPORT- updated

Click on graph to enlarge

THE NEGATIVE ENERGY leading up to JULY 15th, had it occurred at
ANY OTHER TIME would have PLUNGED the stock market in a 25% decline,
BUT That was NOT within the WAVE count as noted in the graph above.

THE NEXT BEST TIME FOR A POTENTIAL 13 % or More decline is coming up shortly,
so DO STAY TUNED TO THIS STATION FOR THE LATEST UPDATES 
Jay

PS
Daneric has another interpretation which has a great deal of merit - 
BOTH OF OUR ideas LEAD to a 5th wave conclusion when a deal is struck for raising the debt ceiling- right at the last moment.
His chart focuses on July22nd, but in actuality, the deal itself
for the market doesnt need to be drafted - IT ONLY NEEDS TO
get the GO ahead.
more later
Jay

Friday, July 15, 2011

Market Timing-Whats Next -JULY 15th Morning Report

GET READY- MONDAY COULD OPEN MUCH HIGHER
July 15th @ 8:45am

THE market HAS NOT responded in a very serious manner to negative negotiations over the DEBT Limit

And TODAY , IMV, is the LAST chance for such an event.

Way back in April, I had projected a LOW at spx 1250, and we did get that on June 16th

Daneric has been adamant about the current leg being a triangle ending in E at 1295, and it does
look like that just might be the case- thus the NEXT move IS back to 1370 -1400 area.
THe current leg from July 7th to 15th would have to count as a wave 2.

IF the SPX were going to drop to 1250 area today, the INTER wave moves would have been much more
than the 20 pt ranges we have seen during this WHOLE correction from May 2nd.

Check out the current level moves
1356 to 1334= 22 pts
1344 to 1313 =31 pts
1313 to 1332 = 20 pts
1326 to 1306 = 20 pts
AND NOW 1316 - 20 pts = 1296 - 194 levels

****SMALL SWINGS BEGET SMALL OVERALL MOVES****

180 Bars at 11:30 AM
204 Bars at 1:30 pm
228 Bars at 3;30 pm just might offer a great buy opp at 1295 unless the 11:30 low
has been MUCH more excessive and has broken that support level with strong downside volume.

Next weeks Energy atmosphere  becomes much more amiable for making an agreement on the budget
and debt ceiling. THUS all the POSTURING and Badgering has occurred since July 7th in that limiting triangle with 1250 as major support for the corrective wave [4] which ended on June16th.

That makes that 5 wave leg high at 1356 a WAVE 1 of the next impulse wave to 1370 or above.

The Current leg down from that level to 1295, assuming we see that today, would count as a wave 2
in an unusual abcde triangle, Unusual that is, for a wave 2 - which means the wave 4 mentioned above July 27 to Aug 1st- should alternate and be a brief A-B-C. 

NEXT 10 days of course should be WAVE 3 taking the spx back to 1370 or above on or before July 27th.

A 4th wave looks then possible from July 27th to Aug 1st and the 5th wave ENDS IT ALL in August
between the 8th & 18th. -

A 5th FAILURE To break over 1370 would be very suspicious at that time.

ALL THE NEG energy that has been in effect since July 7th has occurred within a wave that
has LIMITED any downside correction to major support. That NEG energy has produced much
ado about the debt ceiling & budget, but not much else.

More Later
Jay

I hope that all wasn't too confusing, and over the weekend, I will try to re-write
the above given what today offers for a low

Thursday, July 14, 2011

Market Timing-Whats Next -JULY 14th Morning UPDATE

JUST as Described DAYS IN ADVANCE- TODAY gets worse as it progresses
JULY 14th @ 9am

EKG seems a little more fragmented than usual, but not sure what that means is anything

But is does seem to reflect the psych read for worsening in the afternoon as the day progresses

the Wave Count seems set up to take a hit at any moment and a small number of techs
have been warning about a sudden & severe sell off possible at any moment.
Seems they are catching up to me, but so far NO ONE sees anything REAL to that effect
CAN it all occur this afternoon & tomrrow???

more later

UPDATE
Once again, we wait for GODOT
looks like wave i of [iii] finished in 5 waves from yesterdays high 1331 to 1315

********
SO now we wait for ii of [iii] to finish
latest for that would be 2pm
BUT iii of [iii] should be late today & ALL DAY tomrrow
regardless of that 13 day cycle at 11am- which could get extended.
***
Next week's atmosphere gets much more positive
right from the Monday open thru Tues at 3pm to start,
But I'll send you more about next week in more detail shortly
I dont know what will trigger THE major descending 3rd wave
, but it would appear obvious an other break down in debt talks

And Ive said it many times
SOMETHING's got to scare the BULLSHITTERS on capital hill to
get something REAL accomplished

 as of NOON, it does look like iii of [iii] has begun but NO collapse as yet.
1294 is the level to watch for a such a possible break down

JAY

Wednesday, July 13, 2011

Market Timing-Whats Next -JULY 13th Wave REPORT


WAVE [i] DOWN shows 5 distinct waves & seems complete at 1314

LETS do SOME MATH

1344-1314= 30 pts for wave [i]

Wave [ii] can be any of the following fibo levels
38.2% = 12pts to 1326
50% to 1329
55% = 17 to 1331
62% =19 to1333

SO FAR we see 1328.62 level as BEN begins to testify

IF THE ABOVE is TRULY wave [i]
then what might be the prospects for wave [iii]??

30 x 1.618 = 49
30x 2.618 =79
30x 3.618 =108

You can subtract from 1334

High Energy should wane by 11:08 am
and a secondary high could occur at 1:30pm

30bars at noon coincides with Neg energy

 more later

Jay

Market Timing-Whats Next -JULY 13th CLOSING REPORT


July 13th @ 8am

The MAIN ENERGY FOR THE WEEK calls for Scandals & Ruination
as evidence of that prophecy, see the Rupert Murdock situation

Psych for today
Ok morning , but expect a dramatic mood change later in the day
 $ issues offer a BUMPY RIDE TODAY

Just as expected the 258bar pivot hit at close yesterday

IMPACT STREAM SHOWING a Marked change today, much more than any day in the past 2 weeks


 Activity index was at 200 earlier, but just took a sudden drop to 33
Dynamic index has been gyrating along its lower channel line

more later
Jay

Tuesday, July 12, 2011

Market Timing-Whats Next -JULY 12th Wave REPORT

JUST AS A REMINDER
Jay

Market Timing-Whats Next -JULY 12th Closing REPORT


NICELY CAPTURED


July 12th @ 7:45am

EKG reflects the POWER DATA & energy for today

Down start --- resolve differences by mid day-- close lower

IF they close on a THRUSTING LOW, then the 258 bar pivot would appear complete
THUS allowing a strong higher opening tomrrow AM till 11am.


Jay

Monday, July 11, 2011

Market Timing-Whats Next -7-11~~~ AFTERNOON Report

BANKING STOCKS HEADED FOR A 5th wave CULMINATION of the current DOWN wave
Jay


SPX

WAVE count seems incomplete- deficient at 1319??
If wave c = wv a then it should have stopped at 1322
1356-1334 = 22
1344-22 =1322

If an impulse wave lower
then the price level should get to 1308
22X 1.618% =36
1344 - 36 = 1308


more bearish countWv [1] was 1356 to 1334
Wv [2] was 1334 to 1344
this latest move to 1319 could be Wave (i) of [3]
if so, [3] would take us to 1281
WE cannot MATCh Elliott & energy MINUTE BY MINUTE.
but, IMV, ENERGY DRIVES ELLIOTT
and
THE MAIN DRIVING FORCE this WEEK is on THsday & Friday
Full moon
Bradley
**UNruly & militaristic
**Death - Evil- Ruination
**Disgrace & scandals

plus
13 day- 84.5hr cycle= same pivot that set the LOW on NOV 21st, 2008@ 11am
WHICH in terms of 13 day cycles = 663 tr days due to the Nov & Dec half days.

FRom NOv 21 to  the MAr 9th LOW was 67 tr days

67 tr days cycle can indicate lo-lo, lo - hi, hi-lo etc.
And one such cycle occurs on WEd @67 to FRi 69 tr days from Apr6th high

The most important convergence is that 666 tr day from 666 on Mar 9th
brot to our attention by Jerry R.
6+6+6 = 18=9,. a FINAL or ENDING #

HOW IT GETS THERE can sometimes be synced along the way
IF the energy force is strong enuf to be an influence-

BUT JUST LIKE anything else we use to forecast the mkt- there are VARIANCES

THE MAIN POINT here is that the ENERGY as shown above
IS EXTREMELY STRONG as IT IS A MULTIPLE CLUSTER.

Just like the week of JULY 4th had a MULTIPLE positive cluster
this week is the antithesis of that.

Jay 

Market Timing-Whats Next -JULY [7- 11} CLOSING REPORT

Tomorrow OPENS WITH 180BARS _ EXPECT A DEEP THRUST LOWER
JULY 11 @ 8:55am

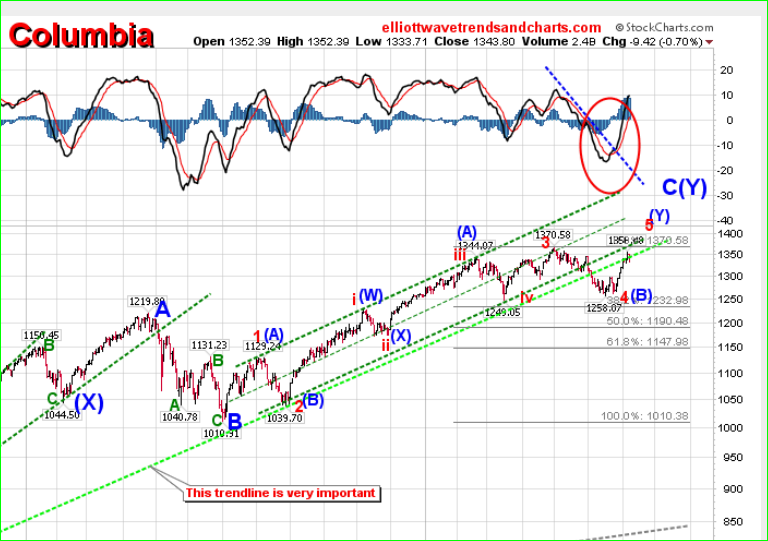
Chart from COLUMBIA 1

NOTE the price levels once that lower GREEN TREND LINE BREAKS

Psych today = Investments in DOUBT

Congressional leaders in DEADLOCK over taxes & spending cuts

WHat will IT TAKE TO MAKE THEM WAKE UP??
IVE WRITTEN THIS SEVERAL TIMES NOW
IMV- ONLY A DEBACLE like SPT 2008 will get them working together

Psych reads
Monday
investments are in doubt

126bars  @ 11:30
156b @ 2pm
180b @ 4pm OR OPEN onTues

Neg energy at
11:23
12:47
+ energy at 1:40 & 3:55pm

MIDNITE LOW TIDE


More Later
Jay

Saturday, July 09, 2011

Market Timing-Whats Next -JULY 9th Weekend REPORT -WAVES


THIS ELLIOTT WAVE GRAPH SHOULD GET YOUR ATTENTION

Jay

Market Timing-Whats Next -JULY 9th Weekend REPORT


THE potential for a SEVERE market SELL OFF seems VERY REAL for this week

SUNDAY's Budget meeting is DESTINED to FAIL
Here's Why
SUNDAY"S PSYCH readings as follows

an undercurrent of tension calls for tact
expect testy & tumultuous moods
Avoid controversial topics  -- yeh, right 

 unpredictable & nervous or sudden behaviors
touchy & temperamental exchange of words
 

______________________
WHAT WILL BE THE WORLD REACTION TO A WALK OUT????
FOOL them ONCE, FOOL THEM twice, but 3 times --hmmm

Just because the rally lasted longer than I expected does not
change the strong negative overtones next week
AND THSDAYS WARNING FOR A potential crash


The next Bradley date is JUly 14th and this FULL MOON
following an eclipse is at 3am Friday, thus the PUETZ crash window
is wide open, and even tho it might not crash and take out 25%, the decline could be substantial


JUNE'S FULL MOON EARLY on the 15th - also led to a LOW on the day after =16th

180pts to 1200 = 13%, which was mentioned in May
OIL should break under $90


MORE NOW
Last week's action has formed a 
TECHNICAL ISLAND REVERSAL- as Ive been told by a blog member

Friday JULY 15th will be 666 tr days NOV 20, 2008 - closing low
WEd has a cycle reverting back to April6th hi and could offer a wv iii low at open
converging with 258bars/ 21 hr cycle

More Later
Jay

Friday, July 08, 2011

Market Timing-Whats Next -JULY 8th Closing REPORT

July 8th at 8:30am


ALL EYES ARE NOW looking at 1370 to 1400
And just like the LOW at 1258, everyone was looking for 1240 to 1228

PC ratios yesterday are 80% Bearish -

Today's psych includes yesterday's Psych
TODAY =  A ROLLER COASTER RIDE & EKG confirms it as well as POWER DATA.
Resources PLUNGE was yesterday's but that obviously did not happen
BUT that does NOT negate the Forecast

I dont think this is the right time to GO BULLISH
BRADLEY turns have been good this year and MOSTLY have hit on highs- Yesterday
Yesterday was an 8 day HIGH. making today and 8 day TURN

All the Non Farm Payroll reports int he summer months have been WORSE than expected
and the revisions also

I dont think today will be any exception, and may be even worse
Im expecting CONGRESS to WALK out on budget meeting on Sunday, and ONLY
 a major market decline will get them off their complacent Butts.

Today's open could catch BULLS BY SURPRISE in BIG WAY.


The ABOVE was SENT AS AN EMAIL to one of the VPN members at 8am
The charts were sent last NIGHT


MORE LATER
Jay
THE next paragraph was posted at my Yahoo group this AM by one of the members of that group

1-Since 2000 to 2010,with the exception of 2007,actual data release in July has been worse than the consensus Forecast.
2-Since 2000 to 2010,with the exceptions of 2005 and 2006,July NFP release has been worse than June´s release...Extremely worse during the past 2 years.
3-July´s release consensus forecast for this year is 97k,vs June actual release of 54k,source : http://www.forexfactory.com/#details=32878

So,believing that very probably the numbers of today´s release are going to be worse than expected is the right thing to do.

Regarding Impact of NFP release on SPX...

1-On July 2nd 2010,Friday, the release reported -125k,later revised to -221k...vs +431k(+433k revised) in June...data for April,May and June had been very positive and growing(162k,190k,431k)..so,what happened beginning next week ? A rally that took the SPX from the 1020´s into the 1370´s in 10 months.

2- On May 6th 2011,+244 actual(+232k revised)the NFP release was the best for the last 11 months,and was the 7th consecutive month with positive data...what happened then? After a couple of updays,the market proceeded with the downmove started on May 2nd for a 120+ points loss in 1.5 months.

 MORE LATER

 Jay
 

Thursday, July 07, 2011

Market Timing-Whats Next -July 7th - Morning Report & commentary

JULY7th @ 7:30am
I doubt the ADP report will have uch effect this AM

there seems to be very strong resistance @ spx 1341,

1341 when added = 9 a final number and it has been attempted 5 times in the alst 2 days

Dow = same and was just shy of its NINE and hit 12,643.24, and that resistance is at 12645

Today could be a day of marked contrasts from the AM to the PM

More Later
Jay
PUETZ crash window IN EFFECT RIGHT NOW
>
> He concludes that a full moon in general and a lunar (eclipse) full moon
> close to solar eclipses, in particular, seem to be the triggering device
> that allows for the rapid transformation of investor psychology from manic
> greed to paranoia. He asks what the odds are that eight of the greatest
> market crashes in history would accidentally fall within a time period of
> six days before to three days after a full moon that occurred within six
> weeks of a solar eclipse? His answer is that for all eight crashes to
> accidentally fall within the required intervals would be .23 raised to the
> eighth power less than one chance in 127,000."


10am ENERGY today is the last time for spx to try and make it over 1341 or fail to hold, even if they do pierce that number briefly 

1341 when added = 9 an ending #
Dow 12645 = 9 and they hit 12,643.24
Trannies = 2556 , when added = 5, which represents a CHANGE
util @ 437 = 14 =5 = change
Russel = 845.28 = 17 , reistance at 846 = 18 = 9
AMEX = 2389 -- resist = 2390 = 5
I dont think ive ever seen this convergence with so many indexes at one time
Jay

Wednesday, July 06, 2011

Market Timing-Whats Next -JULY 6th Commentary

So far, out of the 20 signs, there's one that's sending up a red signal flare - U.S. sovereign debt CDS, which is directly linked to the dollar (see chart above).
The U.S. does not have control over many of the indicators listed here, but at least the No. 1 risk factor -- the U.S. dollar -- is influenced by the national debt and by the monetary and fiscal policies set by the U.S. government and the Federal Reserve.
The longer the debt ceiling debate lingers, the more likely the bond market would start reacting and demanding higher interest rates. A sovereign credit downgrade as a result of missing the debt ceiling deadline would just translate into billions more in interest payments, piling on to the existing debt.
The United States is not like Iceland or Argentina, resorting to default as retorted by some could mean calamity not only to its citizens, but also to the rest of the world. Unless the government and this Congress get their act together, there will be no bailout, and instead of one lost generation to the Great Recession, there could be multi-generation missed in the next Grand Depression.

FROM ECONMATTERS
7/6/2011

Market Timing-Whats Next -JULY 6th- HISTORICAL REFERENCE


Ive SHOWN this GRAPH a few times in the past few months

IM showing for ONE REASON ONLY

IT SHOWS A MASSIVE 29% LOSS in 4 DAYS starting April 20, 1940
THEN bouncing around off the LOWS for a few more days, bottoming on APR28

SUMMARY
IMV,
WHEN CONDITIONS ARE optimum for this, it can come out of the BLUE, or so it seems.

At that time there was a correction in progress from the Prior year with a peak on October 11th, 1939

MY conclusion ~~ The mkt gyrated in a NARROW range for almost
9 months before CULMINATING on the above dates

Daneric mentioned we could be waiting for a nasty E wave, and as such the mkt could plunge as low as the spx 1100 area, but IM NOT PROJECTING that at all, So don't come back and Exclaim-
YOU SAID SO.
THEREFORE- it is possible, but not probable.

9 days starting July 5th ends on JULY 15th as IVE mentioned several times, & IMV, no matter
WHAT THE LOW price level, that should be the BOTTOM of WAVE [1],
with a possible retest on the 19th, -THUS setting up the NEXT rally to that MID August wave [2] peak.

More Later
Jay

Market Timing-Whats Next -July 6th - Morning Report

JULY 6th @ 7:30am
There is one positive influence at 8:16AM

Afterwards , i would expect the futures to turn quite a bit more negative than they are at 7:30am

Jay

Tuesday, July 05, 2011

Market Timing-Whats Next -July 1st - 15th Energy Guide

UPDATE JULY 1 to 15 - published July5th @ 2:30pm

This update takes into account a high on JULY 1st instead of June30th as previously shown
Jay

The ORIGINAL JULY GRAPH is fairly close to the above with some refinements, but overall
it tells the same story

this graph doesn't show the finer detail as the top chart does
but it wasnt designed to those specs.

Market Timing-Whats Next -July 5th - Morning Report

July5th @ 8:30am

NO CHANGES to anything Ive previously published

Jay

Monday, July 04, 2011

Market Timing-Whats Next -JULY 4th- SUNDAY Report-

HELGE

Charts Edge

Jaywiz Projection
Its gratifying to read all the BULLISH outlooks from many sources from Friday-
Will the market REALLY give bulls a continuation from here to 1370 this week or NOT?

IMV, As a WAVE 1 we should see a FIBO level decline from the 704 pts gained from 666 to 1370

704 X 14.6% = 103pts takes it to 1267-- been there done that in wave 3
704 X 23.6% = 166pts ---------to  1204-  could be next
 Friday's high @1340 - 1204 = 136ts down from here

More Later
Jay

MORE NOW - 6:30pm on JULY 4th


Chart is from Columbia1- Michael Eckert
         Clearly SHOWS poor volume and divergences
IMV, the NEXT 10 days have the right ENERGY to convert the long awaited "5"th wave as noted above
Jay

Sunday, July 03, 2011

Market Timing-Whats Next -July4th- weekend update

IMV,
INVOKING any constitutional Amendment to RAISE the DEBT ceiling is NOT JUST on the back burner
ITS NOT EVEN OUT OF THE FRIG- or Freezer- take your pick.

TARP was invoked due to a MARKET MELT DOWN- SO why would this be any different
EMERGENCIES get people to ACT, just like 911, Depressions, Hurricanes, & Tornadoes
 
but heres whats being bandied about.

“It's not hard to argue that the Constitution places both payments on the debt and payments owed to groups like Social Security recipients...above the vagaries of Congressional politics,” Epps wrote in the Atlantic magazine.

Bartlett, in a Fiscal Times column noted that, due to the global ramifications of a debt default by the United States, the debt ceiling could be seen as undermining national security. Invoking the 14th Amendment to prevent default, Bartlett argues, “is no less justified than using American military power to protect against an armed invasion without a congressional declaration of war”.

The legal and constitutional basis of these arguments is section 4 of the 14th Amendment, which states, “The validity of the public debt of the United States, authorized by law, including debts incurred for payment of pensions and bounties for services in suppressing insurrection or rebellion, shall not be questioned”.

However, other legal experts have balked at the prospect of the White House usurping the power of the House. Aside from the fact that it would likely create a deep chasm between the White House and Capitol Hill and unsettle investors, such a move would also set a unpredictable precedent.

“All administrations have acted and assumed the debt ceiling is a statute that has to be obeyed,” said Jay Powell, a former Treasury undersecretary for finance under President George W. Bush. Experts agree that the debt ceiling imposed by Congress is an important part of the US government’s system of checks and balances.

In an email to CNN Money, Epps clarified his position saying that he isn’t trying to suggest the president disregard the debt ceiling entirely, but rather that the 14th Amendment should be invoked in a worst-case scenario.

 IMV
NEVER GONNA HAPPEN
AT THE least, NOT without a MAJOR MARKET CRASH
 JUST LIKE TARP in 2008 -
Jay

Saturday, July 02, 2011

Market Timing-Whats Next -JULY 4th- Weekend Report

HELGE NOW shows the NEXT BIG MOVE IS DOWN


THE MONEY FLOW chart look like 5 waves to the LOW on June 24th == "A"

and ONE PARABOLIC massive wave UP to JULY1st == "B"
______________________________________________
Daneric reports the TRANSPORTS made a new all time High on Friday, but IF the DOW fails to match, then that is a CLEAR NON Confirmation and NOT a good sign for a bull trend to continue
________________________________________________________
WHEN a MKT GOES Up in  PARABOLIC fashion, it comes DOWN THE SAME WAY
 NEXT Wave is "C"- and anyone who knows anything about ELLIOTT counts, that can be quite nasty.
1370 to 1258 = 112 pts
1258 to 1340 = 82pts
82/112=73%,, --- didn't even make it to 78%
__________________________________________
Whats that, you say ?? wait till next week-- HMM
Congress not taking its JULY4th break t hammer out the Budget and DEBT ceiling
Tuesday's warning is - BE PRUDENT, Practical, and Dont be overconfident
Thsday's warning indicates major upsets

Maybe SERIOUS SELL OFF will wake them up to agree on something
______________________________________________
Power data was NOT very clear about last week,
and thus was of no help, but this week coming it has returned to normal
indicating a down week.

7th is a Bradley date and is accompanied by some very negative energy which has a historical
correlation with major selling days.

More Later
Jay

Friday, July 01, 2011

Market Timing-Whats Next -July 1st - Morning Report

July 1st @ 8:45am
 PROBLEM WITH BLOGGER SYSTEM this AM - not loading right  ??-

IN other words, even tho previous charts showed a lower close which did NOT happen ,this one
shows a MUCH MORE MARKED decline than the previous publications.

What was yesterdays HIGH?
was it similar to 1987 on Oct6th, when the mkt had recovered from Labor day low with 67% rebound?
Also during that rally had the biggest one day rally ever to that point.

Up till yesterday, many Elliotters were viewing June16th as a wave 3 low, thus this would have been
a wave 4 high, but it violated an Elliott precept, that wave 4 cannot overlap wave 1.
Since that event did occur, it changes some Elliotters outlooks, but not others who never gave that count.
however, it seem many are now thinking June30th was the TOP of a "B" wave ,
thus labeling June16th as an "A"wave.
SO< whats all that goobly gock mean ? you ask, OK -lets explore


IMV,  -IT SIMPLY means a "C" wave is DEAD AHEAD between now and JULY 15th.
"C" waves do not have to CONFORM to 5th wave rules and decline only 58 pts, matching the drop
from 1370 to 1313-- IT can be 1.618, or 2.618, or even 3.618 X 58pts
that would mean anywhere from a MINIMUM of 58 pts to a MAXIMUM of 209pts.

As previously mentioned we see a pattern has developed over the past few months
EOM high and MID MONTH LOWS
June had an ECLIPSE moon LOW and JUNE 30th high preceded a NEW moon Eclipse today @ 5am

at 8:15am OIL & spx futures are backing off some from yesterday's highs, but that doesnt have to mean an IMMEDIATE collapse - What appears might start slowly - could crescendo later today as the EKG shows above

AS you all should know by now, the Forte of this blog is TIME, rather than price
and TIME is telling us to look for a potential MINI crash event between NOW and JULY 15th.

IMV, the best days for such an event appear to be set for JULY 7th & 8th, but more on that later as
we get closer to those dates, looking for confirmation from the POWER DATA & EKG.

WE do SEE the JULY Monthly GRAPH does show dips on the 8th & 15th
the energy effects on both those days are quite negative, but do get ALLEVIATED the week after
Jly-15th, and the MOOD shifts dramatically thru the