THE NEW JAYWIZ 2023

THE NEW JAYWIZ 2023
THE NEW JAYWIZ 2023

Monday, January 31, 2011

Market Timing-Whats Next -Feb1st - Closing Report

4pm UPDATE-NO REAL DROP OFF, but IT might come at the OPEN tomrrow at 126Bars & reading for $$ disruptions

Potential pivots today, but as you can see above and corroborated by the POWER Index, today is mostly and UPDAY 

60bars at 10:30, & 39 hours at about 10 to 10;30
90bars @ 1pm
126B @ 4pm which could coincide with a sloppy close or lower open tomrrow

Jay
IMPACT STEAM SHOWS Strength this AM 


@ 2:45PM - The IMPACT STREAM might be showing LATE weakening
The Activity index has plunged from a HIGH of 400 at noon to 100 @ 3pm


3:30pm FIGHTING to STAY UP, but might be a losing battle-If not today then tomorrow's
 Power data shows signs of weakness

Sunday, January 30, 2011

Market Timing-Whats Next -Jan31st CLOSING REPORT


8:30AM EKG revised based on 8:30AM SPX Futures- showing a mildly bullish open
7PM Sunday NIGHT, subject to 8:30am revision based on spx futures
258bars @ noon
30bars @ 2:30

NOt a fruitful day
better tonight

Jay
8:30am comment
Today calls for STRONG AMBITIONS, but FRUITLESS action
Activity index is FLAT at its lowest values of 33 & 66 ALL NITE into this AM
FLUX, once again has become unstable with strong fluctuations the last 3 days
Impact stream this morning is also heading lower showing lack of strength.
Jay
5pm
I had envisioned a MOSTLY DOWN DAY today, BUT the EKG STill PEGGED the days movement.
Activity INDEX jumped UP TO 300 at about NOON, but impact stream did not keep pace with that.

Saturday, January 29, 2011

Market Timing-Whats Next -WEEKEND Report

Egypt turmoil and market effects will be over Monday

Tuesday's Feb 1st POWER data graph shows STRONG upday followed by Support on 2nd
I will publish it when there is more data to show

Just as PREDICTED
39 HOUR peak ~ SPX @ 1302.52 HIT at 9:45am
and JUST AS PREDICTED, the 228bar cycle @ 4pm was the LOD
180bars at noon was also an earlier low point

Feb 4th next Bradley should be another high, but could obviously FAIL to make any new highs,
thus the DETERIORATION begins and the COUNTDOWN to MARCH 17/28th DEBACLE

More Later
Jay

Thursday, January 27, 2011

Market Timing-Whats Next -Jan28th CLOSING REPORT

IMPACT STREAM SHOWING A LITTLE SUPPORT THIS AM as does the EKG below
As previously suggested MORE attempts to make higher numbers but getting weaker each time
Jay
Futures nearly FLAT @8 am

Today's reading calls for Optimism & energetic teamwork

 180bars at noon
204bars at 2pm
228bars at 4pm could be lod as 258bars is expected Monday at noon

39 hours at 10am could offer the hod today

1301.08 hit yesterday at 3:55pm and it was a BRADLEY turn date
Next Bradley dates are
Feb 4th
Feb 17th
And I still expect them both to represent highs
March 10th & 17th also

More Later
Jay
MORE NOW
THE TOP 3 CHARTS DAY SAY IT ALL
Monday should sell off some more, but could recover some by days ends and
FEB 1st can offer a VERY STRONG RECOVERY

Wednesday, January 26, 2011

Market Timing-Whats Next -Jan27th Closing report

This is as of 8:00am, but 8:30 data weakened the Futures- NO DRAMA tho
And the IMPACT STREAM Above emulates WEAKNESS this AM
Here we can see the PROGRESSION over the next 3 days
tomrrow's EKG agrees with the POWER DATA
Looks like ONE or TWO more tries to break out, but it doesnt look like they can hold
12,000 dow or 1300 SPX

Tomrrow's POWER DATA shows a lower day, and dotto for Monday
more details later NO, more NOW see graph on top


90bars tomrrow at 11am
Jay

I tried to place this comment at the top of the page but the system wouldnt allow  it
BUT yuo can clearly see that what I published yeestrday and my comment about the power index
Showing today in advance was EXCELLENT

Impact stream at the top of the page showed late strength
Next 2 days do appear should be somewhat weaker and sell off some, but I dont expect any
thing dramatic.
Jay

Tuesday, January 25, 2011

Market Timing-Whats Next -Jan26th PM Update

IMPACT STREAM above SHOWS LOW ENERGY THIS AM- IT DROPPED from yesterdays close
And the ACTIVITY INDEX is also showing LOW energy at 66 @9:30 AM


258bars at 10am 
30bars at 12;30pm
60b @ 3pm
Neg energy most of the morning tomrrow
Improves in the afternoon

26 hr cycle at 10am 
Fed announce at 2:15pm

Jay

Monday, January 24, 2011

Market Timing-Whats Next -Jan25th Closing Report


WE can NOW see with the FINAL close of the day AN EXACT REPLICA of Today's SPX
THE LEFT side of the IMPACT stream showed WHy the MKT rebounded to a higher HIGH
BUT now we see the RIGHT side which is TODAY showing the stream UNDER the LINE
Indicating more weakness than yesterday


 It appears that the POWER data did a one day switch with Monday-Tuesday

 Not sure why that may have occurred, but im looking into it.

180bars @ 10am today might offer a low
204 b @ noon
228B @ 2pm
which gives us 258bars at 10am tomrrow


Energy Tues & Wed seems a bit negative and the daily readings are also negative
Jay

Sunday, January 23, 2011

Market Timing-Whats Next -Jan24th Closing report

ABSOLUTELY PERFECT today


Matches the POWER DATA index published EARLIER today garnered from a different source
Mixed influences tomrrow, but nothing earth shaking

Should continue mild until FEB 4th, the next Bradley date, and even as late as the 11th, or 17th

Feb is showing some weakness in the last week
March is showing major weakness in the last week
see the graphs on the upper right of the main page.

Jay

Market Timing-Whats Next -Jan projections

1st QTR 2011 Projection
2011 ANNUAL projection- ignore %-ages & dates on graph
Nothing mush happening this week as per above graph
a Bradley date on the 27th also appears insigificant

Published a first qtr guide which will stay online until next Qtr report
Published an annual guide as Ive done b4, but this one will stay online all year

Jay

Thursday, January 20, 2011

Market Timing-Whats Next -Jan21st Revisions


The graph above does not include the close, Expect an 8:30 AM update
258bars came late today at 3;30 @ 270 bars but still within cycle limits

The 21hour/ 258 bar cycle was discovered by Stan Harley who passed it along to me
on the crystal ball web site- True, its not the answer to everything, but does point out clearly the cyclical nature of the mkts, and he has also identified the Major timing cycles that the mkt follows over longer period of time.

Friday pivots
30b@ 10:30
60b @ 1pm
90b@ 3:30
more later
Jay
more now
 8:30am update
IMPACT stream seems to be gaining strength this AM
Activity index was at 100 all night and is now at 233
Today's POWER data agrees with the EKG, up most of the day, weakening later
Jay

Energy this week Jan 20 to 27th

Monday Jan 17th was a Bradley date, and Tuesday 18th appears may have peaked at 1297
SPX 1300 is FIBO, and a lack of getting above could be deemed as a change in trend.

Neg energy is heavier the next few days from the 18th to the 27th
27th read does call for power struggles, but abates later leading to
a better day on the 28th calling for optimism & dynamic teamwork

I had projected Jan 20th many times over the past feew months as an important turn point
and at present, that may have been right on target.
More later
Jay

Wednesday, January 19, 2011

Market Timing-Whats Next -Jan20th Closing report

We can see from the above toward the right side of this graph
a dip at open, recovery and now drop off


 Keep this in MIND- EVEN tho the EKG shows a LARGE move lower
does not insure such will occur- THE EKG MERELY points out intrday DIRECTION
IF this is USEFUL to you, then USE it to your advantage-

HMM< It looks like SELLING will continue, possibly to the 27th, next Bradley date
Jay

THERE are web sites out there that will give you SPX trading parameters for the day- Maybe I should incorporate that data with the above or provide a link, which I'm sure many of you already have bookmarked.
COMBINE the data from both and You can get a good idea of what the SPX will do today

Also use the Pivots provided by the bar cycle break down which I provide each day, and daily readings which indicate a pos or neg bias.

204 bars @10am
228 b @ noon
258b @ 2:30

More later
Jay

Market is following the COURSE laid out this AM by the EKG

Market Timing-Whats Next -Jan19th PM update

IMPACT STREAM a little WEAKER today than yesterday & futures are lower at 9am
IGNORE EKG AMPLITUDE- IT can ONLY be used for DIRECTION

Todays full moon is at 4:22 pm

126bars at 10:00am might off a short term pivot this AM
150bars at noon could be a secondary pivot
180bars at 2:30 could set the stage for a late recovery
HIGH ENERGY appears at 1:09 pm today

note
The longer we go without a serious sell off, the greater reality grows for that March debacle

Power data this week is benign showing very little change this week
Jay
WOW, finally a day of selling but the dow did not respond in like kind

Monday, January 17, 2011

Market Timing-Whats Next -Jan18th PM report


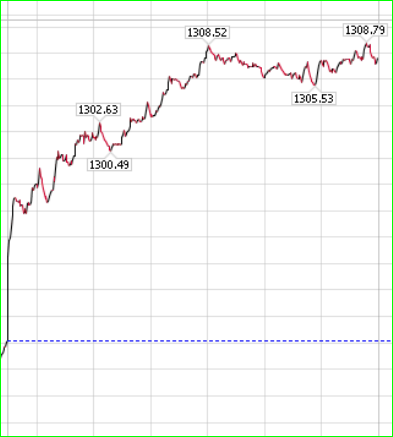
IMPACT STREAM SHOWS WEAKNESS THIS AM
Positve energy may have been spent by now, or there could be just little more to go before
a serious correction begins- its hard to pin point exactly when the energy shift effects traders thought
processes and gears them toward selling.

Fed days next week, Jan 25-26, energy doesnt appear positive at that time, and next week seems to be deeper into the energy change/shift.

228bars on Thsday last week pivoted the mkt higher on Friday, and 258bars at 12:30 was only a very moderate blip.

Tuesday pivots
90 bars at 1:30pm
120bars at 4pm which could spill over to Wed Am, but afterward the way appears to have positive energy

ENERGY EFFECTS for the week
Tuesday = negative
Wed = Postive
Thsday = positive afternoon
Friday = negative

I had previously discussed and projected an important turn on or about Jan 20th, and we are ALMOST there, but dont expect the mkt to fall out of bed just yet; The most negative energy is set up for mid to late March, but Feb may give us some indication that a correction has really begun.

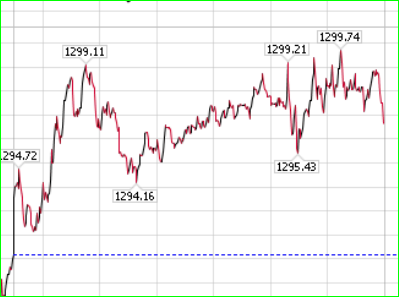
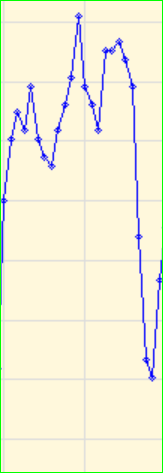
 Power data graph for This week shows little or no change, and the EKG might change for the OPEN

once the 8:30am to 9am reports are published

Impact stream right now at 7pm Monday appears much weaker than it has been for a few weeks past.

ALL in ALL, the mkt appears to be losing strength form my perspective above, and I havent even looked at volume or Adv/Decl tech data
On Dec 13th, the INTERNAL tech data reported its LOWEST numbers in years indicating
a GROSSLY overbot market, and yet the bunny kept on rolling higher. so we will have to be from Missouri, and see it in price erosion to confirm the data.

BEARS have been getting BULLED OVER, and just when they thought it would never happen, we might just get that over due correction- and note the strong mkt IMO, is not due to Fed pomo, Bonds, gold or anything else fundamentally similar.

more later
Jay

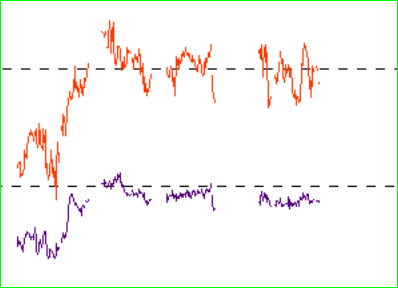
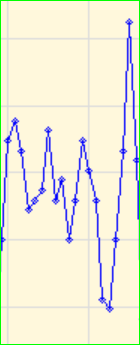
WE really have to make mental adjustments for the implied volatility that the EKG seems to SHOW.
Since it comes to me that way, I have little or no way to adjust the graph before publishing it, and it would be untrue to change it in any way whatsoever.

Wednesday, January 12, 2011

Market Timing-Whats Next -Jan13th Advance report

ONCE AGAIN, the DAILY EKG proves it power

THIS IS ONLY A HALF DAY report and the close promises to be higher according to the days energy reading.
Jay

Tuesday, January 11, 2011

Market Timing-Whats Next -Jan12th NOON update

NO BEARS at this party


DEM BULLS IS FIGHTIN HARD to keep this afloat
Tomrrows close is not shown yet, and that could change as could the OPEN
GYRATIONS WITHIN A NARROW RANGE
DUh - So when are we gonna see sumthin worthwhile ??

Again, and again, IM going to show that graph weekly and LEAN on it for direction, of which there aint much cookin so far this year, and thats because the bulls are still BASKING in positive energy.
That changes after Jan 20th, but the REAL NASTY is not due until late March

8:30am -THOSE BULLS ARE NOT GIVING UP

This may be my last publication till next week- will have only limited access next 2 days
Jay

Market Timing-Whats Next Jan- April 2011

THE TOP boxed in YELLOW represents the HIGH of Jan 14th, 2000
And what FOLLOWED was a DRAMATIC drop in April 2000, making a low on NEG energy on
April 15th.
January's  have provided MANY tops over the years and being 11 years from 2000 has a good shot for a repeat, but for other reasons also.
2000 - 13 fibo years = yep 1987
more than 11 years, but a major dive for other reasons

Jay