
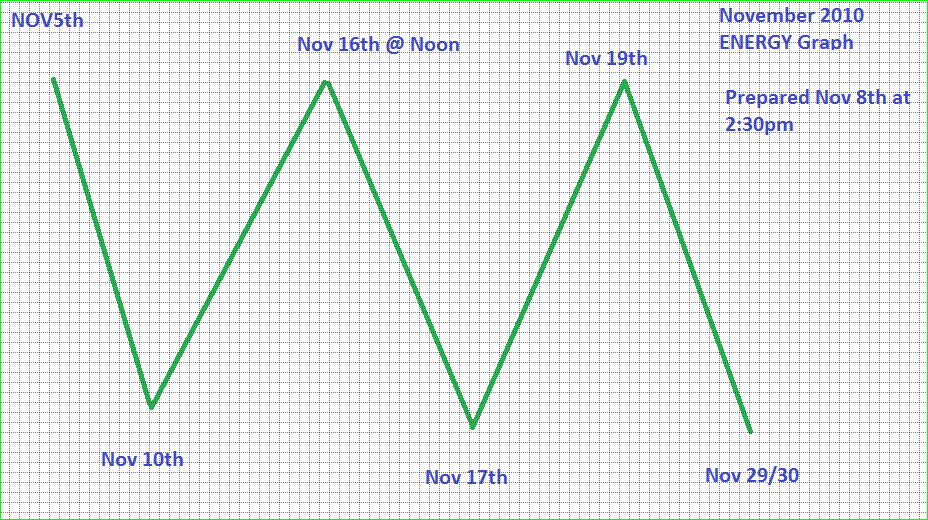
 This TYPE OF GRAPH may be a much better representation of the
 ENERGY pattern for NOV
As previously mentioned IT IS NOT BIASED for the MONTH in its entirety
and thus should offer short term traders better insight as to whats next.
Jay
 Heres Nov Energy graph For better or worse
We see ENERGY waning more so after the 19th
I have been translating energy into stock price movement the past 2 months
which has been obviously wrong for OVERALL direction.
this leads to think I really should NOT show it like that, but more liek I did with the 3 month graph, just interim monthly flow, but that one also showed the 4th as a low, and obviously that was upside down.
Nov 10th should show the FIRST kink in the market's armor
We should be able to tell a little better if the graph will hold its validity based on
the 10th's action
10day OEX PC ratio is quite bearish at .70
and overall PC ratios have been mostly 80% bearish the last 2 weeks
Jaywiz ratio, however has NOT confirmed the above, and we wait to see
what it will show tonight.
Nov 11th is Veterans day, but the mkt is open all day
Sat was a Bradley date following one on the 1st and 4th
all led to HIGHS for the week along with a convergence of multiple cycles
Next Bradley date is Nov 16th, which is indicated as a high & turn lower
and that TURN is SCHEDULED FOR NOON
More Later
Jay
3 comments:
Thanks for sharing Jay - I agree ... seems like one more push up pending - then a correction for a week or so ...
S&P 500 Futures before opening bell: CLICK HERE
the choppyness of your chart seems to fit the idea of a triangle for wave x. this would mean that the initial decline might be the most severe. maybe a 5% drop to 1160. then choppy rest of the month in a huge range between 1120-1160. then back up to new highs?
cementzak
Post a Comment