THE NEW JAYWIZ 2023

THE NEW JAYWIZ 2023
THE NEW JAYWIZ 2023

Monday, November 22, 2010

day trader EKG for Nov 23

Once again, the End of day sell off appears it will occur tomrrow and
an LOD is possible like today at 10am @26hours & 126bars at the same time

Jay

yesterday , the LOD hit exactly on the 258 bar pivot
the next 258 bar pivot is on the 29th

Tues has a 120 bar cycle hit at 4pm

BUT
wed has 26 hr cycle at 10am
&
126bars @ 10am
and the day is called SOUR
Expect QUARRELS

Thursday is TURKEY DAY-- ENJOY

We are getting 26,000 visitors/ MONTH

Some of you please make some comments
let us know your here- we want to know you
and do sign in as a member

more later
Jay
______________________________
Its now later 8 am Tuesday

Flux indicator showing big activity
Power data indicates gap open lower
8am futures indicate Dow off 100 at open

Since the 29th is ONLY a few sessions from today, the mkt has to settle into
its cycle lows, thus the action should be heavily biased lower

Jay

Day Trader UPDATE for NOV 22nd

ONCE again we see the END OF DAY rising with no late drop off, but like Friday's
late sell pictured off, IT DID OCCUR on OPEN Monday
And the SAME is VERY LIKELY FOR TOMORROW
***
LOD was at a combo of cycles
78.6%/13 day at 12;25
258bars at 12:30
LOD was at about 12;30
Jay

It does look like wave iv is not finished yet as per GURU comments on previous page

Which means we spend more time today trading near the 1200 level today until
that wave iv triangle is finished

11am- So far today It does look like wave iv is in progress with a contracting triangle

WILL IT FINISH AT 3:05pm TODAY ??

thats what the EKG is IMPLYING, but we have to see the proof at today's close

What REALLY matters is the OUTCOME of the NEXT few days till Nov 29/30

Monday & Tuesday's readings may be flipped
today appears MIXED
making tomorrow a serious day, and the EARLY EKG does show tomrrow weaker

A low is due at 258bars {21hrs} at 12;30pm
from there, a rebound to a high energy pt at 3:05 might just give us that turn

ONCE the wave IV CONTRACTING TRIANGLE finishes,
then its OBVIOUS to look for wave V.
That triangle confines the upper line to a level under 1200.

Waves 1 to 3 took out 55 spx pts from 1227 to 1173
55 X 1.618 = 89 pts which would take the spx down to 1111
Im rounding off, which I hope is OK with some ELLIOTT xperts

TIMING points toward NOV 29th
144 tr days from May6th, and we all know what happened on that day
Nov 30 is 144 tr days Nov 30, which closed lower
BUT those cycles could flip on each other where the 29th closes lowest,
and the 30th makes the TURN


Jay

Sunday, November 21, 2010

Day Traders-weekend comments

MOST times, I would agree with Columbia to look for a B then C wave higher
later this week,
BUT
MY outlook has an IMPORTANT low Pivot turn on Nov 29th, thus time is
TOO SHORT for the mkt to spend it making more waves higher.

This week
Friday's OPTIONS ratios show 100% BEARISH

Monday
a serious day with arguments

Tuesday
early caution
MIXED Signals
Better later

Wed
Poor prospects
SOUR DAY
anxiety

Thsday

Friday = 1pm close
expect a GOOD START
becoming unsettled after breakfast time

more later
Jay

Friday, November 19, 2010

Day Traders EKG - Nov 19th

that EKG could have worked out better or actually PERFECT without the eod sell off
And for those newcomers, Ive often written, the DATA stream is CONSTANT, thus ITS up to ME to CHOOSE what the end of the day might look like.

Contrary to the EKG, MY outlook did CALL FOR AN MID DAY SURGE and I had encouraged
my Yahoo group to WAIT FOR 4pm to go SHORT- which as of the moment looks like a GOOD BET for a sell off on Monday
Jay
Energy levels take a DIVE after Yesterday's strong runup
However, that does NOT immediately translate to lower stock prices

Today's mid day surge appears to wane by days end.

The SIZE of the above directional movement might be misleading

Today promises to be somewhat frustrating, but expect a mid day surge
and that late sell off might NOT occur, or if it does, then it might be like yesterday
with only a moderately lower level than mid day.

Fibo Price levels are still the same as yesterday
1210 potential, and if we see that today b4 4pm, I will be shorting it.

more later
Jay

Diabetics -
for a non RX way to CONTROL your blood glucose levels,
go to
http:/diabetes-for-dummies.blogspot.com

Thursday, November 18, 2010

Day Traders EKG - Nov 18th

Just as predicted, a late drop off
Jay
It does LOOK like the 144 FIBO trade day cycle from April26th hit yesterday
and as suggested earlier this week and the NOV guidance graph shows,
the 17th looks like it has provided a short term pivot low.

DOES THAT MEAN a new BULL RUN to 1300??

NOT imo,
IMO, only represents a a short term rally in an ONGOING trend
LOWER to NOV 29/30--the NEXT FIBO convergence.

Power index does SHOW a HIGH early today as currently indicated by the Opening Futures

39HOUR Cycle at 10am appears now as a possible HIGH, but not neccesarily THE high
of this contra trend rebound

1227-1173 = 55 OHH, theres FIBO again
wave 1 down ??

wave 2 rebound now in progress??
13pts = 1186 --already gone, according to 1190 opening futures
21pts = 1194 -- very likely
38pts =1211 -- maybe, but doubtful

Reading for today
RESISTANCE dissipates

Friday
Some frustrations
but
Mid day SURGE = progress

more later
Jay

Wednesday, November 17, 2010

Day traders discussion group

From what Ive read and heard, the above looks pretty good
Jay

Day Traders EKG - Nov 17th

Today calls for a cycle convergence

258bars at 10:30

neg energy at
10:19 am
2;37 pm
3:48 pm

60bars at 3:30pm might allow for a late rise off that pivot

The down trend continues for NOV
but internals are becoming oversold somewhat and a bounce Ths & fri would be warranted

Jaywiz ratio = .59-- is still borderline

Would like to see a Jaywiz index under 20 at least 3 times in the last 10 days of Nov

Nov 29/30
144 tr days May 6th
89 July 26
Neg energy & readings
but the 30th calls for a better days ending

Day before & After T day are usually thought of as positive, but in a downtrend
this rule of thumb might not be applicable this year

Jay

Elliott wave Graph from Columbia

Chart from Columbia1
1155 or 1133 current targets-imo, this week today or at 10am tomrrow

Jay

Tuesday, November 16, 2010

Day Traders EKG - Nov 16th

that DOWN close expected MIGHT show up on open tomrrow
Jay
Today is a Bradley turn date, BUT that turn may have come yesterday midday

PC ratios are 80% bearish

Jaywiz index @ .56= borderline

Anyone got a good handle on wave direction?

are they IMPULSING in wave 1 lower
OR
making 3 waves in a wave 4 retreat

NOv 5th this year might be comparable to Nov 4th, 2008
making March a possible important pivot low as did March 2009
One big reason for that, IMO, is an abundance of NEG energy on March 28th

more later
Jay

November Market Guidance

As we can PLAINLY see the TREND for NOVEMBER has been DOWN and according to the
ENERGY for THIS month, it has followed that trend quite well

PLEASE DONT EXPECT these graphs to SHOW every NUANCE daily
MY crystal ball is just NOT that good

however, the day traders EKG is STILL capturing DAILY activity with 70% accuracy since March 24th.

IS the MKT impulsing lower ?
Is it wave 1 of a NEW DOWNTREND into 2012
IS it only a 4th wave to FIB support, and a run back to 1300??

All good questions
but for now the trend for Nov is DOWN as shown above
and it can be just as relentless going down as it was in the uptrend,
and in fact we ALL know, downtrends can be brief but serious-
they come down faster and harder than they rise.

more later
Jay

Monday, November 15, 2010

Day Traders EKG - Nov 15th

That MID day DECLINE now looks like a closing decline,
but what does that do for that expected late rally?
simple - as has happened before, it moves the LATE action into the next day

In fact the EKG for tomorrow does indicate an up open and
as mentioned several times, a NOON high and more serious turn lower afterward.

Jay

Typical bear market days open higher, and close lower


Does look like much ado about nothing today

somewhat Mixed to a positive bias

Mid day bars cycles =
150bars @ 2pm
OR
156bars @ 2:30

Could be that mid afternoon pivot as shown on the EKG above

TOmrrow - still expect a NOON high & turn lower into a 39Hr cycle low at 10am on the 18th

Monday
rough edges & some emotional turmoil
get early start

Tues
Easy going in the AM
Noon discomfort

Wed
Dissatisfaction

Ths
Disputes early
renewed harmony

Fri
feel good day
make progress
Mid day surge

Jay

Sunday, November 14, 2010

Day Traders-weekend comments

DOLLAR now at 78.15, looks possible to 83
Jay
Heres a graph from Columbia which typifies what many Elliotters are thinking

Wave 3 culminated Nov 5th
wave 4 now in progress
imo, NOV 29-30 might end the 4th wave & at what levels that Fibo can provide
wave 5 still coming afterward, whatever that will get to.
BUT
Timing wise, Im looking at Jan 4th and or 24th, but mainly the 4th as there is a Solar Eclipse on that day, following the Lunar eclipse on Dec 21st.- possibly a pivot low

more later
Jay

Friday, November 12, 2010

Day Traders EKG - Nov 12th

Darn close to the real days action
still achieving 70% accuracy over time
now since March 24th
Jay
KEEP in Mind that the EKG is NOT EXACT- but represents DIRECTION more than Amplitude, so dont be misled mentally thinking something that is not, but as you can see it works damn well
Its only 7am, and Im early- got an appt to go to

If the 7am futures hold at open, then we should see the
above till at least 10am at the 13 hours cycle


We appear to be in a battle between the buyers & sellers ; --Duh, of course

but its Different from Spt & Oct where most of the Selling was restricted to a few days

This month we see selling every day, but recovery during the day from
those staunch bulls who are still in buy the dip mode.

when will bulls get the message?
Later this month when selling overwhelms buying, or buying just dries up

Yesterday's FLUX action was HEAVY most of the day
Today, so far is Heavy again, but is only part of the day, thus we see that translated into
the EKG above.

30b@ 10:30
60b@ 1pm
90b@3:30-- could set the tone for a late recovery as above

Many bulls still HOPEFUL for a return to 1225, but I really tend to doubt that

the daily readings seem to be pointing toward a low on the 17th,
with a POSSIBLE plunge starting at noon on the 16th

more later
Jay

Thursday, November 11, 2010

Day Traders EKG - Nov 11th

As we can see from the 7am futures, we are expecting a lower open today- Friday Nov12
Seems to be a repeat of yesterday
Jay
PICKS up where yesterday's Closing gap left off
more later
Jay

Wednesday, November 10, 2010

Day traders - EKG- Nov 10th

NOW WE SEE the RESULTS of the LATE GAP down which
DID HIT at OPEN on the 11th
EKG STILL performing at 70% accuracy since March 24th
Jay
JUST AS I mentioned this morning- The end of GAP lower did NOT materialize
and the LOD was at the 39hours mark at 10am
Jay


According to the above EKG graph, the end of the day looks like a gap lower
BUT, I cannot vouch for such price action related to stock prices as a surety

Today's reading is quite harsh as previously posted

39 hours at 10am could be the hod

120bars yesterday was due at 4pm but did seem to hit at 3:50pm, darn close
leaves the door open for that 10am high

Tomrrow- Veterans day with banks closed should be low volume

Jay

Tuesday, November 09, 2010

Nov 9th EKG & commentary

OK,
Here we GO Loop d Loop - all on NOV 10th
Will it be a repeat of May 6th ?? without recovery?
Such an event would leave NO doubt about a break of the triangle

**********
There are multiple negative energies about to influence tomrrow

trouble & Loss
disharmony, evil, & secretive
bitter power struggles
39 hours at 10am
126bars at 10am
Jay

Today's reading
BE FLEXIBLE = EXPECT CHANGE Today
OK morning
Power struggles this afternoon

Flux indicator yesterday had moderate activity
Today so far - ditto
Activity index started yesterday at 266- ended at 200
Today is at 100 to start

Today is a FLASH "gravity day"

60bars at 11am
90b @ 1:30
120B @ 4pm --- OR open tomrrow

Wed Nov 10th
Tomorrow is BILLED as a day with many obstacles
Snags , Barriers & roadblocks
POOR Biz day

Fibo cycles
110 Jne 7th low
233 Dec18, 08 low
89/90 July 2nd Low

The next Bradley date is the 16th which calls for an easy going day
with a NOON time TURN LOWER for a low on the 17th

This is CONTRARY to previous outlook presented in
Oct for the 144 tr day cycle off Apr 26th,
but it would appear that the BIGGER cycle convergences last week
were in control of the recent highs- see Ian's blog

More Later
Jay

Monday, November 08, 2010

November Market Guidance

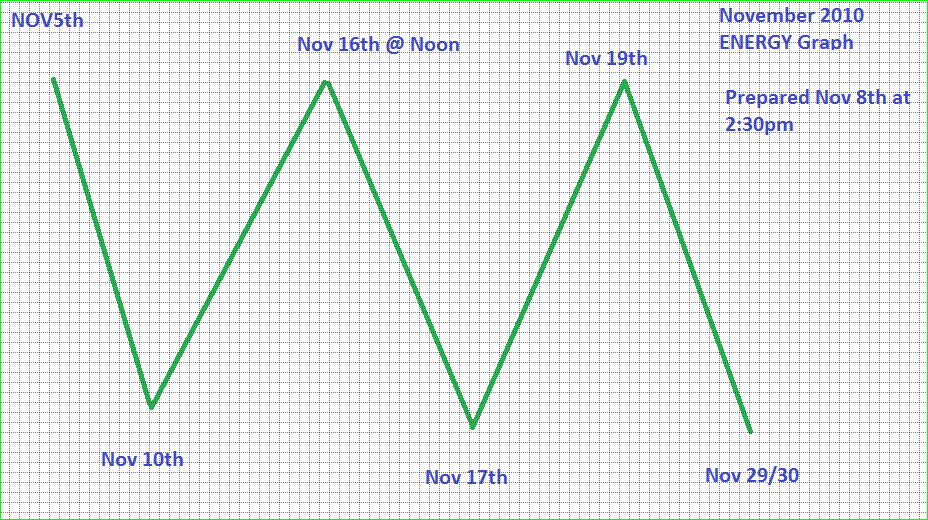
This TYPE OF GRAPH may be a much better representation of the
ENERGY pattern for NOV
As previously mentioned IT IS NOT BIASED for the MONTH in its entirety
and thus should offer short term traders better insight as to whats next.
Jay

Heres Nov Energy graph For better or worse
We see ENERGY waning more so after the 19th

I have been translating energy into stock price movement the past 2 months
which has been obviously wrong for OVERALL direction.
this leads to think I really should NOT show it like that, but more liek I did with the 3 month graph, just interim monthly flow, but that one also showed the 4th as a low, and obviously that was upside down.

Nov 10th should show the FIRST kink in the market's armor

We should be able to tell a little better if the graph will hold its validity based on
the 10th's action

10day OEX PC ratio is quite bearish at .70
and overall PC ratios have been mostly 80% bearish the last 2 weeks
Jaywiz ratio, however has NOT confirmed the above, and we wait to see
what it will show tonight.

Nov 11th is Veterans day, but the mkt is open all day

Sat was a Bradley date following one on the 1st and 4th
all led to HIGHS for the week along with a convergence of multiple cycles

Next Bradley date is Nov 16th, which is indicated as a high & turn lower
and that TURN is SCHEDULED FOR NOON

More Later
Jay

Nov 8th EKG

Another good day for the EKG
Jay
Not sure about this but something just feels different

Flux active this am, but was deathly quiet last week

13day cycle pivot at 11 am
258bars{21hrs} at 12:30 pm
positive energy at 2;17 pm
seems to emulate the ekg above

Jay

Sunday, November 07, 2010

weekend commentary

WELCOME Members # 129 & 130

glad to see new people signing in

Ive added more content and sponsors
for your benefit, and of course to build more traffic here

My GOAL is to make this a PLACE where we can DISCUSS the market technically so that anyone reading our comments can benefit from a COLLECTIVE knowledge

If you think Im not looking at the right things, then tell us ALL why, How, and When with detail such as charts, cycles, Elliott, or other wise

BUT PLEASE Dont just write comments and SCREAM "YOUR WRONG" -
and write something like POMO money WINS over cycles.
AS traders, and technicians, WE ALL KNOW BETTER !!

Ive witnessed cycles where lower interest rates were heralded with higher
stock prices for months in a row, UNTIL they AREN'T- and the mkt tumbles

The ONLY REASON POMO money is
APPEARING to lift the markets is
BECAUSE it is happening at the RIGHT TIME in the CYCLE

thanks in advance for your contributions

***

Im contemplating NOT publishing a revised NOV graph until the 11th
let me know if you would rather see it NOW or on the 11th
Jay

Friday, November 05, 2010

Todays STOCK market

MONDAY PLUNGE ???
Maybe and maybe not
I'll publish an adjusted Nov graph over the weekend

basically
after high today- on Nov5th

expect Negative days on
8th to 10th
10th =more likely a plunge day
16th to 17th
22nd to 30th
In between expect positive days

Contradicts that NOV 4th LOW previously published graph as we possibly got that EXHAUSTION
thrust HIGH on NOV 4th, turning that Oct graphs upside down.
AND CONTRADICTS that NOV 17th
HIGH at 144 tr days from Apr 26th

IT would appear the CYCLES, that IAN published for THIS WEEK are more important.

The length of time between Nov 22nd and 30th obviously makes that time frame more dangerous

I know Ive LOST a lot of PEOPLE due to my CONSTANT negative calls
but I have to report based on
the info & data Im getting

LIKE May, this month could offer the WORST Nov in 70 years

the FIRST KEY date is NOV 10th
If it resembles May 6th , we will know how serious this month
will be, and since its next Wed, we dont have long to wait.

INTERNALS as seen on the 2 graphs I posted from Columbia do who INTERNAL WEAKNESS, not to be IGNORED
regardless of FED funding banks
They may wish to sit back
for a week, or month to see if they want to invest in stocks that have already run up.
OR
Maybe they will sell now, and buy back when those stock are available at fire sale prices

Jay
PRAMOD
HIGH of day could be 3:45
based on energy
180bars at 12:30 right now making a little low
204bars next @ 2:30, or 210 @ 3pm could open the door to close near the HOD

EKG does NOT give specific TIMES
I have to derive that from OTHER
means, but thanks for asking


I would really like to get more commentators with OPPOSING DATA
- NOT JUST STABS & JABS in my back.


It would be great to make this a FORUM where we can BOUNCE ideas OFF each other with data, charts, graphs, energy, etc to back it up

for example
Ian's BLog is a place to GET INFO
this is a place to DISCUSS the market- whats next

LETS USE JAYWIZ BLOG THAT WAY

thanks
Jay


Nov 5th Stocks Todays ekg

AS expected ,today traveled in a very narrow range hitting ths hod at close which I mentioned in my comments

New moon tomorrow denotes a change in trend-
just how much a change will be determined by the
first down leg to occur on NOV10th next Wed.

Maybe the start of a NEW direction such as in 2008,
NOV 4th High gave up 2000 pts by Nov20th,
before retracing back to Jan 2009.

or just a retrace in an continuation of the uptrend off the
March 9th, 2009 lows at 666.

Jay
Was that SURGE a 5th wave Final THRUST 0r overthrow for real?
It will take a few days before we really know that answer to that

Elliott technicians say "make it so"
McClellan and other internals as pictured yesterday seem to agree

Is this high similar to April26th , or is that just too easy ?

Too much MONEY flowing in to the market to see any sell off ??

today has a few fibo convergneces
89 Jul 1st low
55 Aug19 hi
49 Aug26 low

New moon tomrrow
Bradley date -6th

more later
Jay

Thursday, November 04, 2010

Stock Market-Technical Charts


FROM COLUMBIA public chart pages

they both show this rally has limited life

whether its today or Nov 17th, the end of this rally is near

how much more can the bulls get out of this,
& is this the rally that sucks in the unaware ????

Jay

Stock market -Waves -5th or not

5th OVER THROW ?

There are 2 touch points at the lower line
and
2 touch points at the upper line

IS TODAY's OPEN touch point # 3, making the 5th wave of the traingle ??

as mentioned
Nov has a cluster TODAY and again on NOV 17th
how do they fit in with each other ?

Is today the ultimate high OR will NOV 17th surpass?

more later
Jay

Stock Market -Nov 4th EKG

CERTAINLY not one of those days that contributes to a 70% accuracy rate
Lets hope tomorrow shows better results & returns to normal
even 70% accuracy means that 30% of the time we get one like today
Jay
Everyone is wondering - How long can it last?

Fed induced rally wont END

NOW OR EVER ??
thats a really good question & we all know the answer to that.

EKG shows effect of overnight European rally derived from QE2 or whatever
but the open looks like a higher high than April26th is coming this AM

How long can it last?
The EKG says only briefly & we have a 13 hr cycle this
Morn anytime between open & 10am

more later
Jay

Wednesday, November 03, 2010

NOv 3rd EKG

NEAR PERFECT
still holding 70%
Jay
Yesterday was not as close to reality as the EKG has been, but still not that bad
did not catch the end of day recovery to a new closing high at 1194.

SOME techs are reporting that NOV 17 to 19 is a VERY IMPORTANT Cycle Change
and even consider that might be the HIGH of this WAVE
one important cycle on
NOV 17th is 144 tr days from April26th
there is also a high energy force working at that time
as well as the OPTN Expir
& FULL Moon on Nov 21st

I cannot DISPUTE that at all, but it would mean the Current wave continue s
to vacillate ina narrow range between 1177 and 1200 to possibly make a top at 1220 or higher, thus matching or slightly exceeding the APR 26th HIGH
OR
is Nov 17th the RECOVERY point back testing a declining price line from a PEAK
today as indicated by a huge CLUSTER of cycles as shown by Ian at his blog

elections did NOT disappoint, and Im sure the FEd will not either
buy the rumor- sell the news ?????

more later
Jay


258bars at 10:30 could set the lod for the day,
OR 60bars at 3;30
OR both

Also got a pivot low due 78.6% /13 day at 12:25pm
Along with 30bars at 1pm
and neg energy at 12;40pm

more later
Jay

Tuesday, November 02, 2010

Nov 2nd EKG

STILL running at 70% accurate DAILY since MARCH 24th
we see the late upswing DID make a higher high, but the end of day did drop off but not as dramatic as the EKG shows, and once again proving the direction is more important than AMPLITUDE
Jay
12:30pm Nov 2nd - note
Can never be certain if the late upswing will be higher or not
DIRECTION counts more than Amplitude
Jay


39 HOUR CYCLE at 10am
might be HOD or LAST HOY

Will Wall St approve GOP restructuring - wheres the BEEF- NO - I Mean $$$

Calm gives way to chaos later today

STILL ZIGGING in 3 waves

Activity index was as high as 300 early this AM, but now at 133,
after bouncing off 66 & 166 in between

Jay

Monday, November 01, 2010

Ekg Nov 1st & weekly readings

NOT as perfect as some days, but still darn GOOD
Jay
EKG indicates ONE MORE DAY of PUNISHMENT - WAITING WAITING
A Contributor- indicates the ODD lot SELL SIGNAL again reinforced on Friday
Remember I wrote IF the HORIZONTAL TRIANGLE wave is finished- & it would appear the mkt has one more day or most of today still working.

Monday
Bradley Date
500 tr days from NOV4th, 2008
770 tr days from Oct11, 2007 TOP
Positive energy at 9:43am
Pos energy at 2:15pm

sandwiched in between
120bars at noon
150bars at 2:30pm

Today calls for a fair day- things go well
BUT WATCH out for EXCESS & dont believe everything you hear
which AGAIN is another warning

Tuesday
Yesterday's CALM is replaced with CHAOS
banking & $ unstable
180bars @ 10:30


WEd
Confusion & Chaos - repeat of yesterday
wishful thinking- make no commitments
Fed QE2 at 2:15pm
78.6%/13 day at 12:25pm
258b @ 10:30am
30 b @ 1pm
Neg energy at 12:40pm


Thsday
Neg energy at 10:47am
13 hours at 10am to 11am
90bars at 10:30am
Bradley turn date

Jarring start with early upsets & rebellion
BOUNCE BACK later

Fri
A GET AHEAD DAY

more later
Jay

Sunday, October 31, 2010

Whats Next & WHY

It has been noted by some that as of OCT 30th
ENERGY effecting human behavior may have hit a brick wall

It would not be surprising to be unable to make any progress beyond this point
OBSTACLES are significant

As we have already seen, national security has been threatened once again
even if only involving a minority group,
it shows as there are HUGE HOLES in the hierarchy

This week we have a convergence of HARD energy
where there seems to be a great deal of DESTABILIZATION

Responsibilities & accountability clash with rebellious behavior as well as
retribution for misguided FINANCES this year.

Panics can be the outcome of the above energy, but take heart, it may only last a few days

Getting back to that Elliott chart, IF we are TRULY at the edge of a wave 2
contracting triangle, the aftermath can be as described above for the markets

Looking back at 2008 we can make note of a 500 tr days cycle hit on Oct 29th from the NOv4th high of 9625, and the mkt fell to 7552 on Nov 20th

Ian pointed out many cycle convergences THIS WEEK- link to his blog on my main page on the right

Jay

Saturday, October 30, 2010

Contracting Horizontal Triangle

The ABOVE triangle, IF FINISHED ,
denotes a PLUNGE to the widest part where it began,
which in this case would be about spx 1100.

Jay

CHECK OUT THE LINK --
IAN"S BLOG
EXPLOSION or IMPLOSION next week

Friday, October 29, 2010

Compare wave to EKG today

OK once again
Jay
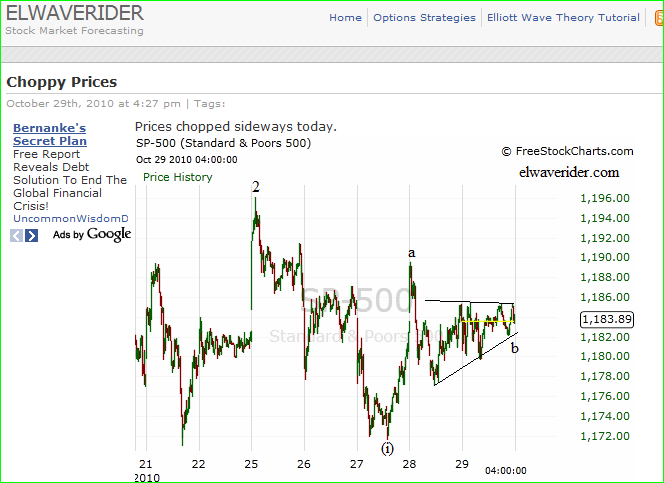
chart above FROM ELWAVE RIDER
IT WOULD APPEAR that IF we close at or near 1190 today,
which is somewhat indicated by the EKG, that MIGHT JUST complete wave"c"-2
OPENING the DOOR for wave 3 DOWN without warning

Fascinating that the POWER GRAPH seems to be showing Monday as a PLUNGE

And technical trader KNOWS the MKT iS VULNERABLE at this point, no matter
what the FED does

BILL MERIDIAN says the MKT runs into a BRICK WALL this weekend, and that
seems to fit a TREND CHANGE or at least that ALLUSIVE PLUNGE thru the 4th
Jay

NOT much happening today

Pos energy at
10;30 am -- so far on track, and its now 11am
3;49 pm

55%/13 day cycle at noon might be a low
60bars at 1pm

reading calls for a pleasurable day

I FIND IT VERY HARD TO SEE HOW A PLUNGE IS AHEAD OF US
LAST CHANCE for near term in up to NOV 4th
AFTER which, the mkt should have legs to run higher into Nov 19th to 21st

Energy patterns do NOT show support for such a plunge
Bradley PATTERN does NOT show such such a plunge

ON the OTHER hand, from what we KNOW about markets VIA charts, graphs, cycles, Elliott
tech data, we see WEAKNESS inherent in our present price level

IS the mkt building DOUBT within a very narrow price range, or will it open up , even if briefly for 2 or 3 days thru the 4th??

What will it take NEWS, or fundamentals, to get SELLERS into the trade??
Disappointment over QE2???

Wed's read does call for Confusion
Thsday AM calls for EARLY upsets, but a positive afternoon

Neg energy did pull the mkt lower on the 28th, but NO WHERE near as low as
we might have thought given the wave, energy, charts, etc

SO where does that leave us

SIMPLE- WE WONDER WHATS NEXT- ME TOO

Jay

Thursday, October 28, 2010

Oct 28th EKG

Contrary to what I thought yesterday about this AM, we seem to have an UP open
setup and confirmed by the futures, but it does appear short lived, at least for the morning.

A Later recovery might or might not make a higher high than yesterday
or this morning but we see the trend is UP after that 11am low ive been
mentioning and might just peak at 2pm

THE POWER Graph shows a HIGH on NOV 1st with a downdraft into the morning of the 4th- JUST why that would happen on a fundamental reason might involve the FED, but
the power graph knows nothing about such matters

Jay