THE NEW JAYWIZ 2023

THE NEW JAYWIZ 2023
THE NEW JAYWIZ 2023

Tuesday, May 17, 2011

Market Timing-Whats Next -May 17th Closing report

 
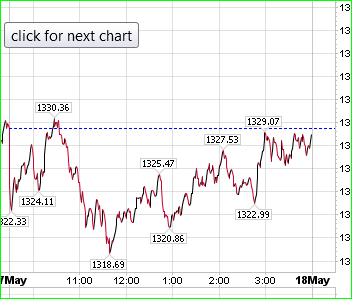
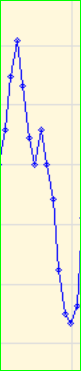
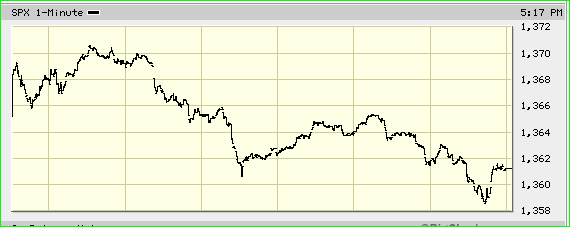
Yesterdays EKG after the close did show a late recovery as above, but was not published that way at 8:30am
May 17th @ 8:30am


Since it doesnt look like a seriously lower open, I cant envision a move to anything below 1300.

AS noted there is a GAP at 1315 to 1320 which seems likely

however, IF they do get to 1300 today, that will set off NEGATIVE SENTIMENT and thats a sign
to expect a short term bounce

Jaywiz index last Ths was .22= bearish
                           Fri was. 15 -VERY BEARISH
                          Monday =.50- BORDERLINE, but leaning toward bullish

Today's main cycle keys off the FEB 9th HIGH

26hrs at 10am
90bars at 11;30
126bars at 2:30 = might be the lod

Tomrrow opens 150bars at 10am, thus we could see a great short term BUY opp at that time
There is a warning to be wary of what looks like great bargains-


Jay

DOW OFF to a greater degree due to HP

Monday, May 16, 2011

Market Timing-Whats Next -May 16th WAVE E progress report

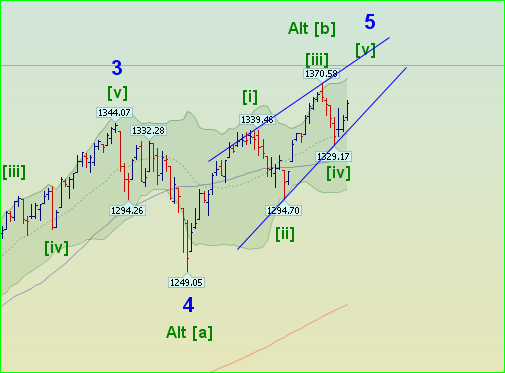
THE SYMMETRY of the above wave would indicate we are within WAVE 3 or as marked above
between waves (b) & (c)

As such the graph would also indicate an ending low equal to the difference between 1344 & 1370 =26pts
BELOW the previous low at 1250 which would set this middle at 1250, and the lower wave "C" at 1224.


the lack of a very serious plunge would seem to confirm the above also, but the day is still young.

Jay

Market Timing-Whats Next -May 16th Closing report

May16th @ 8am
SINCE futures are Pointing to a lower open, I see no reason to wait till 8:30am to publish the EKG

looks like they open lower, back test and continue to slide ALL AS PREVIOUSLY PROJECTED

Forget about yesterdays amusing projection for an UP open- sometimes, the up becomes a back test.

IF not the fear of NOT raising the debt limits, its what each party will have to give up in the process.

expect Unstable and peculiar events
expect scandals with no successes

Jaywiz INDEX Ths = .22 quite beaish
Jaywiz index Fri .15= VERY BEARISH

258 bars at 10:30 along with next energy at the same time could offer the AM low.
78.6%/13 day at 12:25 could also offer another pivot low

Tomorrow's FM calls for UNYIELDING attitudes toward Money & resources.
Instability & insecurity abound

Wed provides a reprieve but be wary of what might look like a bargain

more later
Jay

SCORE ANOTHER SUCCESS FOR THE EKG
HOORAY -- STILL AT 80% DAILY accuracy

Jay 

Sunday, May 15, 2011

Market Timing-Whats Next -May 16th prelim report

Wave 2 may not have finished yet, unless they open DOWN, but we'll see what the SPOOS say at 8:30am
CHARTS EDGE this week


NOTE
JAYWIZ INDEX on THSDAY was .22, and thats quite bearish
Jaywiz index on friday May 13 was .15, and thats VERY BEARISH


 more later
Jay

Market Timing-Whats Next -May 13th Missing report

May 15th @ 8:30am

THE GRAPH ABOVE WAS FOR MAY 13TH-
May 16th wont be available till 8:30am, but the prelim shows possible UP open, with drop after 10:15a

Murrey Math indicates SPX 1312 next support
THEN spx 1250, but How soon they dont show.

BUT if the above occurs in the NEXT TWO DAYS, it fills in my GRAPH, and will be an OBVIOUS wave iii of 3 spike down.

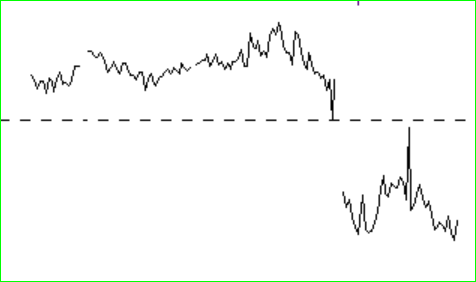
Monday's EKG shows its very likely to sell off after a brief higher open.

Full Moon is Monday at 7am, and similar to April they sold off the day b4 and the day after- 15th & 18th
March 16th low was 2 days prior to the fm


Alphie's chart above shows the FLOW of the MONTH fairly well,
but the DATES are not in sync with mine until the 20th as a high-
place the 17th where he shows the 20th & move the 20th to the right on top of the next hill.

Psych readings
Monday - indicates something Peculiar but unfavorable
Tuesday- increased tension , avoid risk- complications & confusion
Wed= UPBEAT
Ths- Mid day shift from pos to neg
Fri - Potent GROWTH
_____________________________________________

LOOK OVER SPIRAL DATES on the main page
May 2nd is shown as a high - OK
May 10th is shown as a low - It was another high
May 13 is indicated as a high and they sold off
May 18 is indicated as a HIGH- WILL THAT INVERT as the other dates seem to have done?
May 31is indicated as a low to which I agree
 You can scroll back to read where I compared that chart to mine or match up on the main page
Just enlarge your screen to read the dates or use a mag reader-
Windows vista & 7 both have magnification features
______________________
More later
Jay

Thursday, May 12, 2011

Market Timing-Whats Next -May 12th Mid Day report


THe Graph on TOP is from APRIL 1940, exactly 70 years ago
WILL that CYCLE repeat in the next few days ??

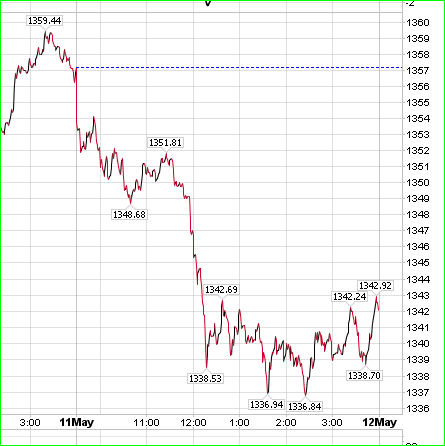
The lower graph is RIGHT NOW showing WAVE ii of 3 IN PROGRESS
of which we already seem to have completed wv i of 3 this morning.

IF we are going to get a repeat of the 1940 wave, imo, it has got to start showing action tomrrow
at the latest.  wave iii of 3. which looks like it took 3 days to complete, ending NOW on May 17th
if that is what we are going to get.

Wv- iv of 3 to complete on May 20
wv v of 3 to end on May 25 and or 27th

Jay

Today's rebound limits
 1359 to 1332 = 27 pts lost


27x 50% = 14 + 1332 = 1346
27X 62% = 17 + 1332 = 1349 -= right there now at 2pm as I write this
78.6% = 21 + 1332 = 1353
Jay
 
The rebound off the first drop from 1370 to 1329 hit 1359 or 73% 

Market Timing-Whats Next -May 12th Morning report

May 12th @ 8am


 I published the EKG early simply because, IMO, the 8:30 am reports will only accentuate the negative

Daneric's page has 4 scenarios for the current trend.
#4 which projects that we have seen the top,
and will not be going back up or even sideways.
THE PROOF FOR #4 should occur in the next few days

JUST AS I TOLD EVERYONE HERE THAT GOLD, OIL, Metals, Softs, would ALL crumble
GAS fell 25cts yesterday - UNHEARD of prior to today
 Watch the price of GAS drop in like fashio in the next few days & weeks.

WHAT GOES UP PARABOLIC will COME DOWN THE SAME WAY


GOLD hit 1575 recently
SPX hit 1575 in 2007 and fell to 666 within 2 years
IS THAT the FATE OF GOLD ?? within 2 years along with stocks, oil, soft commod.
DEFLATION has just knocked at the front door.


THE PROOF of Daneric's graph #4 should make it apparent today and tomrrow thru the 17th

I did not envision the Wed drop, and the power data did not show me the last 2 days correctly-
THEY DID seem to FLIP  as well as the psych readings
THE high energy yesterday only served to support the mkt till after 11am, and again later.
Just as I wrote- OK start- SLOPPY mid day, and better close.


TODAY we have
90 bars @ the opening
126bars @12:30
156b @ 3:pm

POWER STRUGGLES OVER MONEY is the PSYCH for today & tomrrow
Stumbling blocks & recklessness

the above seems to indicate the CONGRESS will have quite a battle the next few days
forcing negative activity under the UNCERTAINTY that ensues

the FULL MOON on Tuesday @ 7am indicates an UNYIELDING attitude toward MONEY.
IT WILL be FASCINATING to watch Congress respond to markets crumbling, and how they will respond, depending on who declares a pending BK.- probably meaning the UNITED STATES.

more later
Jay

Tuesday, May 10, 2011

Market Timing-Whats Next -May 11th Closing report

Tomrrows EKG matches the OUTLOOK and Daneric below


Danerics graph shows today as possibly marking the top of a 5th wave ENDING Diagonal triangle
If the mkt makes or attempts a new closing high for this year.-TODAY

What comes right after on the 12th & 13th could set the stage for whatever correction
has been illusive.

spx 1380 should be there by 11am
Mid day does get soft, but the end of the day makes a comeback


_____________________
 6am update
Impact stream at 6am showing strength to match everything else
Jay

TOP OF THE PAGE IS THE IMPACT STREAM AT 11:30am
IMO, A FAILURE TO MAKE ANY NEW HIGHS today is a death knell
AND
Any new highs also ends the END DIAG Triangle if thats what forming other than the
Irregular or expanding triangle previously discussed

Either way, It looks to me like the next move is a large drop on the 12th& 13th
Jay
1370-1329=41 pts
1359 = a 73 % retrace
A full 78% retrace is at 1361

Market Timing-Whats Next -May 10th Closing report

THATS A far cry from what was projected - GRRR

Impact Stream & EKG at 8:30am May10th
AS PROJECTED, the SPX is set up to open at 1350, at or near the upper resistance level.

From there, the day is called to lose steam, as we can see from the IMPACT STREAM.
Power data agrees also as it starts out at the 400 level and drops to 250 by days end.

SO, what is the lower limt??
From Fibo, we can look at the charts and see whats next.
lets look at it as an abc drop from the high=  3 legs
1370- 1329= 41 pts = wv" a" or leg 1
1329 to 1350 = 21 pts = 50% wv" b" or leg 2
IF wv "c" should occur today, we could look for 1350-41 = 1309
thus wv "c" would be equal to wv "a", fulfilling an Elliott principle of wave equality

Further more
IF May is going to perform as the monthly graph indicates, we should get a retracement wave UP
from 1310 to:                 1370-1310 = 60 pts lost
60pts X 50% = 30 + 1310 = 1340
60pts X 62% = 37 + 1310 = 1347
60pts X 78 % = 47 + 1310 = 1357
Anything higher than the above levels changes the outlook, but I dont think that will happen.

Jay

Monday, May 09, 2011

Market Timing-Whats Next -May 9th morning report


HIGH ENERGy at
26hrs at 10am
11;11am
11:45am

Activity index flowing at its LOWEST possible value = 33

Possible pivots
126bar s @ 10;30am
156bars @ 1pm
180bars @ 3pm

Tomrrow should open positive also

Upper resistance seems to be at the 1350 level
lower support  at 1300


Jay

IMPACT STREAM & Activity index popped higher at 11am
126bar pivot right on schedule at 10:30sh

Sunday, May 08, 2011

Market Timing-Whats Next -May 7th WAVE report


THIS IS ANOTHER WAVE structure that looks like it has some merit


BOTH PATTERNS INDICATE a level below spx 1250
using fibo math we could project as such
94 pts lost 1344 to 1250
94X 1.618 = 152 pts at a minimum = 1344- 152 - 1192


The meat of this correction should still take place on either of 2 date segements
1. May 12 & 13
or
2. May 23 to 27th

Since this pattern is a 3-3 -5
5 being where we are NOW, we would expect wave iii of 5 to be the biggest spike down
which should place it on May 12/13.

Jay

Saturday, May 07, 2011

Market Timing-Whats Next -May 7th WAVE E progress report


May 5th got us to 1329,  at 3:30 Pm right on a 30 bar pviot

May 6th got us to 1352 at 11: to noon as expected

Monday should attempt one more run to 1350, and might get as high as 1360 again at noon

From that level we should then get a wave low into Tuesday where 258 bars hits at 3pm, and could possibly extend to 4pm = 270bars, not out of the ordinary
That should see a close at or near 1329, if not a little lower.

WEd is expected to rally all day and probably close at 1350

From the Graph above, You can clearly see whats NEXT

Jay


IF THE WAVE ABOVE is REAL, we will see the outcome this Friday, May 13th. If anemic decline to only 1250 or above, then
we will have to review the wave above.

Daneric shows another view of his count which of course at this point
has equal merit.

Even this Tuesday should help identifying just how weak or not this E wave might be depending on how low this current leg gets to. 

Jay 

Friday, May 06, 2011

Market Timing-Whats Next -May 6th Closing report

May6th @ 8:30am
AS INDICATED, we see yesterday's LOW at 3;30 pm on the 30 bar pivot
is now showing dow futures UP 133 pts right at the OPEN

The EKG shows it also
IT CONTINUES to AMAZE me how the EKG shows the DAILY MKT action in advance
and is STILL performing with an 80% accuracy rate since Jan 1,2011

high energy at 10 am to 11am at the latest is NOW in Effect.
How high is HIGH??
40 pts lost, x 38% = 15 pts + 1329 = 1344spx, but we will open above that.
40 pts x 50% =  20 pts + 1329 = 1349, should be an easy target
40 pts x 62% =25 + 1329 =1354
40 X 78% = 31+ 1329 =1360

I wont WAIT for the highest possible value- happy to get the middle ground, but 10;30
has the high energy turn.

Jay

EKG STILL AT 80% - incredible

Market Timing-Whats Next -May 6th WAVE E in progress report

click on pic to enlarge
Expanding Triangle wave E could become much more apparent once wave1 & 2
are complete on May11th.

May 12/13 has the BEST chance of duplicating the flash crash, but this time with NO reprieve

The CRASHING OF METALS & OIL are fore warnings of things to come

more later
Jay

Thursday, May 05, 2011

Market Timing-Whats Next -May 5th Morning report adjunct

Published May 5th @ 9:10am
This should give us some perspective on whats going on this week

We got a DROP as indicated from the 2nd to the open today on the 5th

THEN we see a FLATTENING out today and tomorrow as previously projected.

SOO<> what happened to the EXPANDING TRIANGLE wave E very hard drop??
ITS SOMEWHAT IN DOUBT, as we can only see a minor set back for the month of May so far.
with STRONG opposing forces in both directions.

As the GRAPH shows, we have 3 high points this month
May 2
May 11
May 20
JUNE 1st
And 3 PIVOT LOWS in between
May 4/5
May 13/17
May 27

THERE IS a STRONG HIGH TO HIGH cycle on May 20, off FEb 11
May 20th Might not offer new highs depending on HOW low they get on the 13/17 pivots

May 12/13th is the BEST chance we can see for a duplication of the flash crash, and IF that happens,
then we might bring back the E wave as possible.

BUT FOR NOW, MAY 11th is the NEXT HIGH energy date, and there is nothing in the way of making another high or at least duplicating it and getting a close at 1372 or above

Jay

Market Timing-Whats Next -May 5th closing report

May 5th @ 9am


Today's OPEN as PREDICTED will open LOWER and find support at about 1334-1332 level

220bars & 13 hours at 10am

HIGH Energy at 11:39 to noon might find the spx at recovery hod
258bars at 1pm could draw the day lower at that point, thus allowing further gains on the day, or at least back up to the noon high.

rebound from the open lows should continue thru Monday at the noon hour before running into
strong resistance.

Tomrrow's employ report could offer the same type open, but the day looks like a recovery and higher at
the close leading to a high Monday about noon.
 
1370 - 1330 = 40 pts and very typcial for the spx as a rule of thumb
recover 78.6% = 31.40 + 1330 = 1360.40, and if it supercedes that, we could get see an attempt at 1400
on Tuesday May 11th
BUT the drop back late on the 9th and 10th could limit the rebound to 1360


Jay

 JUST AS PROJECTED
AN early LOW gave us a BOUND at NOON
great trade on that one.
AS IVE SAID MANY TIMES- GOLD< SILVER OIL down sharply

Tomorrow they are expecting a bad employ report, simply because today had a bad jobs report, but the LOWS today hit on the bar cycle pivots
258 bars hit a little late at 2pm, but within limitations
30bars at 3;30 exactly dow off 200 pts, and all the internal indicators
bouncing off that low into the close.
Now that the SPX is at 1335, its right on support levels and hit its low at 1329.
high 1370- 1329 = 41 pts and right on the 40 pts rule of thumb
_______________________
Power data shows potential for rebound in the AM,  lower by the close, but Monday's energy shows possible rally till noon.
Jay

Wednesday, May 04, 2011

Market Timing-Whats Next -May 5th PRELIMINARY report

May 4th at 6pm
JUST as the POWER Graph & Spiral both show a low on the 4th,
we can now see the EKG confirms the notion we will rally off an early low.
Jay

Market Timing-Whats Next -May 4th Afternoon update


THE COUNT BELOW is OBVIOUSLY incorrect and the SPX appears it has no intention of dropping under 1340.

THis has the LOOK of a 4th wave back off from the 3rd wave high of May2nd.


Count the 10 am low at 1345 as wave 1
now waiting for wave 2 to complete some time this am, probably by noon

Use fibo relationships we might consider the following today
25 pts down from 1370 high to 1345 as above= wv [1], now in wv [2]
25 X a.618 = 40 pts
consider wv [3] 40 pts could take the spx to 1310-1315 area later today
leaves wv [4] which would recover from the 6th to the 11th
consider wv [5] ending on 13th, and or 17th   = WAVE "A"

Jay
silver off 20% in a few days- hmm

IF THEY DONT PLUNGE TO 1320 today, 
then 1380 is likely on the 11th


THE LOd so far today was at 1pm right at 180bars
3;30 @ 210 bars should be the next pivot low
1341.50 was the LOD and is right at the 1340-44 band of support
Today lacked the needed energy to plunge
the NEXT date for a possible plunge which has the energy to support
such is May 12/13 as shown on the 2 charts.

BUT prior to that and in ACCORDANCE with BOTH SPIRAL & Jaywiz monthly turns is a possible high energy date of May 11th, and beleive it or not, we could see the SPX at another new high in May above 1370.

There is NOTHING between now and May 11th to get in the way of such a run.
Tomrrow as prev described starts in a disruptive manner & has 2 cycle pivots converge at 10am, or earlier. SO, IM planning as prev mentioned to BUY the open tomrrow.

An interesting {hi to hi} CYCLE has come to my attention
pegging a high on May 20th, which is related to a high on Feb 11


Jay

Market Timing-Whats Next -May 4th Morning Report


May 4th @ 8:30am
Today's read
This morning requires patience -- thats an understatement [grr]
BE Flexible- around noon
Mid day doubts

Looks like this morning lacks direction, but picks up after noon

Jay
 more now
The 5th indicates a recovery as well as the 6th & part of the 9th
later on 9th & 10th are indicated to be down days
11th is a HIGH ENERGY day- all this makes an easy A-B-C count off whatever low we get to today and tomrrow at open.
given the above, where the #^*#^* can they recover from ??
It certainly doesnt look like anything serious is in the works today, expect for the day's reading
indicating a more serious market after noon.
HOW serious ?? cant even put a finger on it- will have to wait it out.
Jay

Tuesday, May 03, 2011

Market Timing-Whats Next -May 3rd Morning adjunct


This chart from Columbia shows the fibo levels from the high @1372 to the previous low @ 1294

He shows Support @ 1332
and
moving ave @ 1318
but not shown on this graph

39 hours at 10am could be a defining high & turn or a low leading to
positive energy at 11:33 which could provide a high today

Jay

at 10am the 39 hr cycle bumped the dow to +$19.00, but the spx holding under water. 

Market Timing-Whats Next -May 3rd Morning Report


May 3rd @ 8am

Yesterday we saw the outcome of distribution, and the real market now begins

The last major correction was April 26th to June30 2010 from 1220 to 1010 or 200 spx pts

IMO, we should see something similar, but the TIME of such appears should be concentrated between
May 2nd as the intraday highs, or April 29th as the closing highs to LOWS ON May 27th -2011

Yesterday's 258bar & 13 day cycle at 11am provided only a minor dip prior to the high of the day
but the minor dip was superceded by a low at 12:30 indicating just how weak the cycle really is.
the DATE of 5-2-2011 =  9-11,  fascinating.

Yesterday's EKG, impact stream, and Power data were all in Sync just as they are today for continuation
of the decline.
The power data indicates more of the same tomorrow - see the graphs on a previous page
Yesterday's Psych read was misleading, but it may have flipped with today-

Sunday's revelations came under an influence indicating DEATH & losses,
thus we could possibly say the fate of Bin Laden was pr ordained for this day.


May 13th, Friday falls in between strong negative influences on the 12th & 17th,
not because its Friday the 13th.
this date should provide a strong pivot low leading to a rally high on May 20th as pictured
on the graphs of both Jaywiz & Spiral

A good pivot turn is still set for 10am on the 5th with the convergence of 13 hours & 220 bars,
which should lead to a high on the 11th high energy day.
 
The FIBO PRICE objective of 78.6% was touched May 2nd @ 1372 spx


more later
Jay

Monday, May 02, 2011

Market Timing-Whats Next -May 2nd Closing Report

Columbia reduced his chart service

May 2nd 9:10am

WOW, BIN Laden gone-
One ESP'r wrote that May comes in like a lion and goes out like a lamb
Spiral graph looks that way.

Still got cycle convergence at 11am, so after the futures have their opening effect, we should see
that cycle perform

Both Spiral & Jaywiz agree on price drop next 2 days
which might just start today after open.

Bin Laden HYPE  is not effecting Europe by much except for the Dax up 50pts

Jay

Sunday, May 01, 2011

Market Timing-Whats Next -May 1st- I Ching

May 1st @ 8:30pm

When I asked this last week, the answer was NO WHERE NEAR like this one

which NOW appears to read extreme SEVERITY, imo.

Jay


http://tinyurl.com/3zdlf9b
GOOD READING for bears

Market Timing-Whats Next -April 21st- May 2011-TURN DATES

May 1st @ 8pm
May looks like a wild month- great for option traders on the right side of the trade

How do these dates compare with Jaywiz?
Ive got a wild looking month forecast also
May2 intraday low- May3 intraday high - nearly similar
May 4th/5th AM low - somewhat different, but both have 4thLo
May 5th low & may 11th high- inverted from above
May 13th low also inverted above
May 20th high - the same as the 19th above
May 25th low & 27th also look like the above
May 30/31st , weve got an explosive rally into June 1st ECLIPSE, not the same as above
we match on 4 out of 6 turns above, not bad, might be useful after all.


Ive published this graph to my site as an FYI-
Look back at April, didnt work out too well, and he gets $$ from subscribers


Recap April
Apr 11th high
Apr 15 high
Apr 18th low, 17th = 18th for trading
Apr 29th High
he got 2 out of 4

This may be not helping us so I might not repeat this publication
next month unless I can find a way to use it effectively.

Jay

Market Timing-Whats Next -May 1st- weekend report


Im waiting for the POWER DATA to complete for the week for comparison to the above
So far it matches well thru the 4th, but the data stream for the whole week is still incomplete.

Monday's neg energy at 9:35am should create quite a downdraft at the open lasting till 11am.

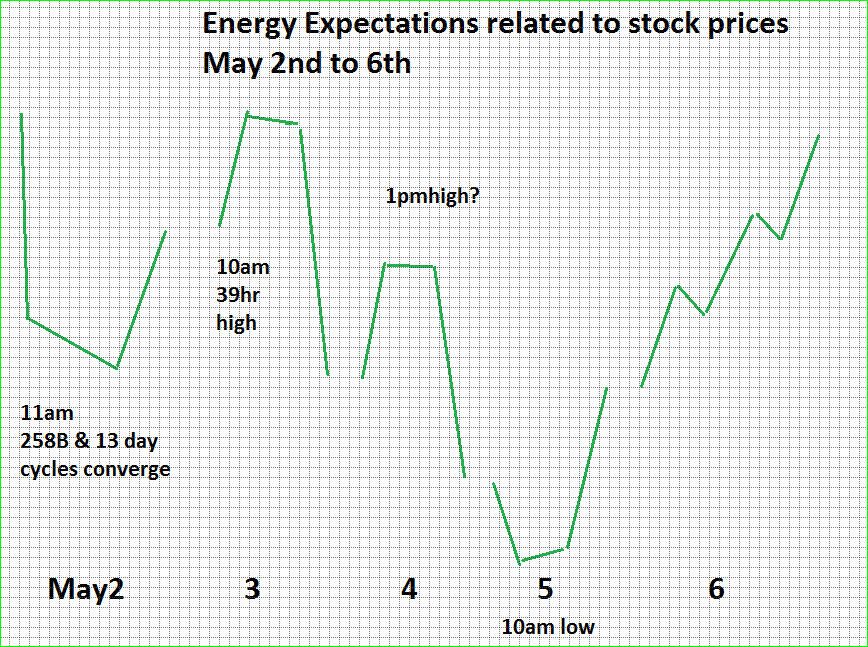
258bar & 13 day cycle are prominent @11am for the turn of the day similar to April18th
the next bar cycle pivot is at 1:30pm, but it stands alone.
The pull of the NEW moon Tues at 2am generally seems to have its typical TURNING effect

IF the goal of WAVE E, if thats where we are, is the lower trend line of the expanding triangle,
then they've got to prove it this week.

Jay
PS; My plan is to BUY the open on the 5th, and hold it for a high on the 11th

 Monday's PSYCH READ
The Day starts in a CLOUD OF FEAR
Outlook improves as the day progresses

Tuesday
Money management requires patience & disipline

Wed
Take care of $4 matters this AM
Be Flexible as midday doubts take over

Ths
Disruptive start
$ affairs brighten later

Fri
Favorable trends continue

Hope this helps, and it seems to coincide well with the chart above
Jay