THE NEW JAYWIZ 2023
THE NEW JAYWIZ 2023
Tuesday, May 31, 2011
Market Timing-Whats Next -May 31st Closing report
Power data shows potential for higher open as we see from the spx futures
but what happens afterward
1370-1312= 58pts
58 X 62% = 36 + 1312 = 1348 potential
I did publish a series of price levels b4 based on the 58 pt drop.
Previous projections indicated May 31st as a low with subsequent rebounds.
That projection appears to need adjusting depending on HOW long spx 1348 stays on the boards.
If 258 bars & neg energy at 10am produces only a minor dip off the open high,
then we could consider higher afterward as a normal consequence of the 258 bar pivot.
There are other reasons to be bearish overall since May 2nd and as soon as this downtrend
ends at the 1296 level or lower, it still looks like JUNE-JULY & till Aug8th has bullish potential
AS a WAVE "4" off 1312 low as wave "3" weve seen rebounds as high as 78.6%, and have offered
those levels as potential targets. that does not guarantee we will see those levels
Others have indicated mid day highs at or near the 1350 level today, before selling off from there.
Check out the LINKS on the main page to get other views of this up move from 1312.
and just what the alternatives show.
Jay
IT looks like that LOW on May 24th at 1312 shown on the qtrly graph as May31st has already occured.
Thus we need to adjust our thinking & outlook to reflect that possibility.
The graph then shows a HIGH on what is still indicated for June1st, or it could be May31st- just the
opposite of my prognostications. SO we need to be vigilant of the possible directional moves this week, after reaching that peak either today and or tomorrow.
I dont hedge or get wishy washy saying if this happens or if that happens then we get-------.
BUT as indicated, adjustments are quick and up to the moment given fresh data.
Jay
Monday, May 30, 2011
Market Timing-Whats Next -May 31st Prelim report
| May 30th @ 7pm |
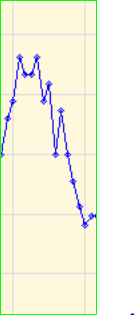
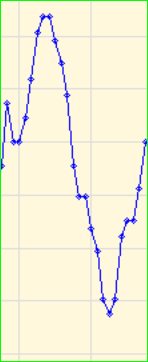
NOTHING has changed, and the EKG DAILY projection is STILL HOLDING an
80% accuracy record since Jan 2011 - which is simple to check out - just go back to January
and review each projection against the actual which is also posted every eve after close
It might take a few hours, but have at it.
258bars & negative energy at 10am
Jay
Im labeling the May correction from 1 to 5 , but it might be more properly labeled a-b-c-d-e
It really looks right for the numeric labels, as wave 3 broke out into 5 waves of its own.
We will really be able to tell better in retrospect, but for our purposes and for actual trading
it doesnt matter right now.
However, I was told by an Elliotter that numbers are impulsive, and letters are corrective.
Numbering infers wave 1 will end at 1296 area, and IMO thats tomrrow.
but IMO, It looks like a 4th wave with 5 to follow starting June1st as previously proposed.
We shall know the answer shortly as a wave 2 should not recover more than 78.6%.
We do know that wave 3 top at 1370 on May 2nd did recover 78.6% from the March 9th low.
and could also be the target for a failed 5th wave or ending diagonal which shows exhaustion of the trend.
more later
Jay
ps- thanks for responding to my OFF TOPIC - we need to remind POLITICIAN'S they work for US.
And we can get rid of them just as easy as it is to vote them out.
thats whats great about this country, WE CAN WIN WARS WITH WORDS.
Sunday, May 29, 2011
Market Timing-Whats Next -Next Qtr projection
A VIEW of PROJECTED PRICE analysis shows a SHARP decline on May31st as previously indicated.
Following that we see the FIFTH wave progress thru Aug 8th
NO matter what level May31st ends at, be it 1296, 1287, or 1275, it will still be counted
as a FOURTH WAVE
NOW, as a CORRECTIVE wave, maybe it should be labeled - a,b,c,d,e, but the outcome
for price projections DOESNT CHANGE.
The corrective labels do allow for the FIFTH wave as shown above thru August.
Otherwise we might view May 31st as the bottom of WAVE 1m and the FIFTH wave
projection becomes WAVE 2 which would normally reach 78.6% to the 1355 area
given a low off 1296 Tuesday. Obviously price projections would change if price falls below
1296.
May 31st should be INFLUENCED a GREAT DEAL by what Asia & Europe do on May 30th
POWER DATA indicates they will have a BAD DAY, which should be an OBVIOUS influence
on our market OPEN on the 31st.
There are SOME indications that Tuesday @ 10am might be the LOD, and the rest of the day just
TREADS WATER, or floats slightly higher during the day.
The above graph also indicates JUNE 1st ECLIPSE day will start the month off with a BANG
WE might only see an attempt to break out above 1370-1380 area during this 5th wave
YES, 5th waves are thought of as powerful, but not following a LONG extended 3rd wave to the
May2nd top.
Thus the entire 5th wave might end up being viewed as a FIFTH FAILURE.
this will count out as 5 waves as shown.
OR
the structure might take the form of an ENDING DIAGONAL -indicating extreme exhaustion.
That structure will be seen as a 3-3-3-3-3, with the 4th wave overlapping wave 1.
Either one will be seen MORE CLEARLY in retrospect.
More Later
Enjoy the holiday
Jay
Saturday, May 28, 2011
Market Timing-Whats Next -June 2011 Directional guide
| JAYWIZ graph |
NOTE That the EXACT dates on each graph will vary somewhat, thus we need to be vigilant
to adjust according to the ACTUAL EVENTs as the JUNE market unfolds.
MY DEEPEST THANKS TO THOSE who have been generous showing their support for
this site, plus the time & effort that research requires daily to keep up with the most elusive
thing that man has ever created- the STOCK MARKET
Jay
Friday, May 27, 2011
Market Timing-Whats Next -May 27th afternoon report
I realize just how much DOUBT is out there for a SEVERE sell off Tuesday to conclude this 4th wave
But as You can see, the CHANNEL is nearly perfect.
And as the END of the (4)th wave, the next wave is an IMPULSING (5)
which should take the spx back to a minimum 1370
1381 is the 78.6% retracement.
909 lost x 78.6% = 715 + 666= 1381
anything more is a gift from the mkt gods-[g].
91.6% = 78.6 + 13.0
832 + 666 = 1498, is where GS projected by year endm but reduced it to 1450
WILL WE GET THERE ?/
Doesnt matter to most readers here at this site where we have mainly sort term traders.
but its nice to know there are possible targets
Of course, wherever the TOP turns out, its scheduled for August 8th at the latest
Enjoy a long holiday weekend and keep in mind, there is severe NEGATIVE energy waiting for the mkt on
Tuesday, May 31st. yes, I know, Ive said that b4, and it has not produced expectations, but the setup is CLEAR, and the reading for May31st is instability, quarrels, death & disease.
sounds lovely [gg]
Jay
Market Timing-Whats Next -May 27th Morning report
Thursday, May 26, 2011
OFF TOPIC, but IMPORTANT
FMEA Legislative Alert
| Please Contact Your U.S. Representative | |
| HR 1891 Severely Cuts Arts Education Funding | |
A bill was introduced in the House of Representatives Education Subcommittee that seeks to terminate 43 federal education programs, including the entire Arts in Education program at the U.S. Department of Education. This bill is more serious than the annual funding measures that threaten to de-fund arts education, as it would permanently strip language out of the Elementary and Secondary Education Act (ESEA) that allows the Arts in Education program to be funded each year.Please see the MENC call to action for more information about the effects of this bill. Click Here to Email Your U.S. House Representative | |
Market Timing-Whats Next -May 27th PRELIM report
| May 26 @ 4:15pm |
Complete EKG at 8:30am tomrrow
Converging cycles at 10am--- 39 hour & 180 bars could set the LOD
or 10:41am on neg energy
Final wave lower has not even begun
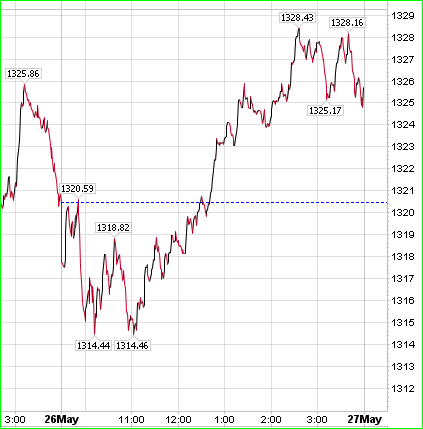
Today's LOW at 1314 did NOT take out the previous low at 1311.80
Wave i of ( v) must take that out--
SEE the LOW at April19th, made a NEW low at 1302, 2 days prior,
and on the 18th DROPPED to 1295 at 10am
Jay
TODAY"S EKG WAS PERFECT - STILL HOLDING an 80% daily accuracy ratio-
incredible -- for SURE
Market Timing-Whats Next -May 26th Morning report
| May26th at 8:30am |
THE ABOVE market graph fist extremely well with the premise for an
ELLIOTT FLAT formation ending TODAY at the 1300 level +or- 5 pts
THE NECKLINE of the INVERSE H&D has a BASE at 1295
THE Elliott formation shown above leaves the DOOR open for
ONE MORE "c" leading to whats labelled as "A" above
EKG confirms such should occur today which agrees with the POWER DATA graph
Yesterday's late sell off indicated today would be lower at least for the morning
Impact stream above is showing lower energy, verses yesterday's slow climb
Activity index gained yesterday very little and today so far is at a low ebb of 66
Technically, some have indicated we should see SPX 1306, and some are projecting as low as 1295, but
that has to be the floorm which may or may not get hit, but if it doesm Im not waiting for anything lower.
38%/13 day cycles is at 10:42am, and MIGHT provide the pivot low
Neg energy at 1:35pm
FUTURES not indicating a PLUNGE at open, so it could take some time to unwind.
Today is a Bradley date, and from all the above data, we must project it as a pivot LOW
Cycle convergence from FEB18th HIGH also seems as an obvious low today
Wave count indicates today making the 5th wave, or "C" wave of the 4th wave from the Mar9th,09, low
which OPEN the DOOR to wave 5 of 5 of 5 ending early August imo.
More Later
Jay
Wednesday, May 25, 2011
Market Timing-Whats Next -May 26th PRELIM report
| May 25th @ 4pm |
It looks like the WAVE COUNT has ONE MORE DROP at open
wave 1 from 1346 to 1330 was 16 pts
Wave 5 which may have started from 1325 today - 16 pts = 1309
IF more than that at open, take it as a GIFT, and IM BUYING LONG
AS a Bradley date & Cycle off Feb 18th, plus a 5th wave finally, IT DOES LOOK LIKE
that should be the END of the Correction that started on May 2nd at 1370, as shown by the Elliott
chart of a FIFTH WAVE EXTENSION.
Jay
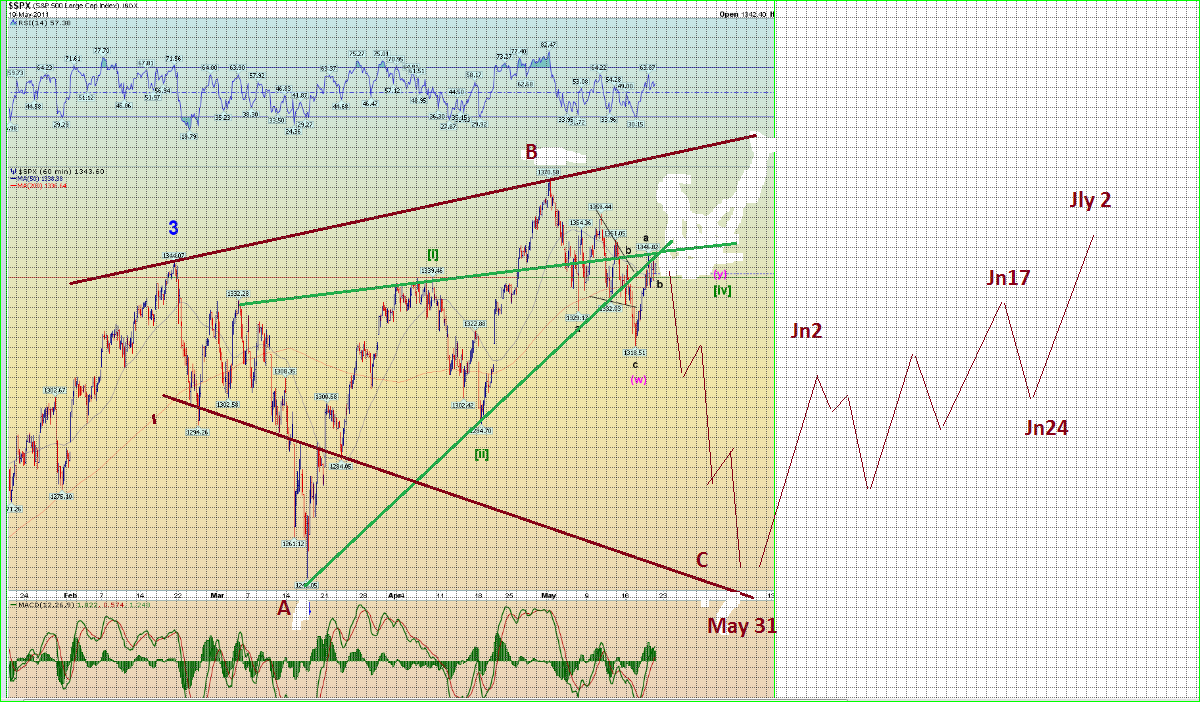
Market Timing-Whats Next -May 24th TREND LINES
the stage for the June rally starting Friday, May 27th.
the channel of the RED LINES seem to show that, once the green channel breaks down.
The expectation of an expanded flat that I previously showed has SHRUNK into a FLAT.
see the previous pages for the charts & details
Jay
SEE Daneric's page- SAME COUNT as mine
indicating a 3rd of 3rd DOWN about to occur
J
Market Timing-Whats Next -May 25th Morning report
| May 25th @ 8am |
Expected not to hold the lower trend line, thus we should get the expected FINAL sell off
aka 5th wave to either 1295, and or 1280 between now and sometime on Thsday.
26th is a CYCLE repeat from the FEB 18th high to low
however, Im expecting a HIGHER OPEN tomorrow already indicated by the ekg & Power data.
that higher open should fail to hold by days end
27th is on schedule to be an UP day.
more later
Jay
Tuesday, May 24, 2011
Market Timing-Whats Next -May 24th Additional Wave report
the only one thats important to the mkt right now is the one on the far right called a
FIFTH WAVE EXTENSION
This extension projection give credence to the May correction being a FLAT OR RUNNING wave
rather than a traditional zig zag
Thus we see reluctance for the indexes to make dramatic declines.
on the right we see WAVE 3 as the orthordox high at 1344
wave 4 @ 1250
Wave (i)@1339 -Wave(ii)@ 1294 & Wave(iii) at 1370
wave (iv) NOW IN PROGRESS to end at 1250 to 1280 in the next 2 days
NO ONE ELSE that I read.
blogs or other wise is offering ANY similar
PROJECTIONS OF THE FUTURE
EVERY ONE ELSE IS TELLING YOU what happened YESTERDAY, last week, or last month
But Im playing MARKET DETECTIVE, and reading under the RADAR to give us KNOWLEDGE
KNOWLEDGE is POWER and that leads to $$$$$$
NO ONE ELSE publishes this--- its called ((( SHOW ME THE MONEY )))
If you appreciate and understand this, then You should respond in like.
OF COURSE , A GREAT BIG THANK You to those who appreciate this KNOWLEDGE
and have been very generous, again I say - THANK YOU-
more later
Jay
Market Timing-Whats Next -May 24th CLOSING report
| May 24th @ 8:35 am |
as projected on the previous page, the FIBO leads to a high possible at 1325
in the middle of the channel lines.
the lower channel line projects a low in the 1250 to 1280 area- thus filling the previous gap
TIME & Energy projections indicate that low on Wed, May 25th at noon
This May time period has not produced a crash effect on stocks. WHY, you ask. good question.
the best answer I can think of is we are watching extensions of the trend to a higher high, on or before August 8th.
more later
Jay
EKG great and rolls over for LOWER open tomrrow
Market Timing-Whats Next -May 24th Wave report
| SAME CHART AS BELOW< BUT WITH CHANNEL LINES |
SINCE yesterday stopped above 1300m the prospect for an EXPANDED flat
is shrinking into a FLAT @1250 or running flat ending at 1280.
Either way, that low should occur on the 25th and or 26th,
That makes the 27th part of the NEXT IMPULSE wave 1
and May31st low at noon = wave 2
thus lending support to my projection for wave 3 spike on June1st & 2nd.
As for today there is LIMITED upside effort till about 1pm
before heading lower again
this effect is also clearly shown by Charts edge & Jaywiz wkly projection.
1347 to 1313 = 34 pts lost from recent wave high to low
recovery should be limited to a fibo of that
38% = 13 pts+ 1313 = 1326
50% =17 + 1313 = 1330 **** Looks very promising for 1pm or earlier today
Note the change from earlier #s
Jay
Monday, May 23, 2011
Market Timing-Whats Next -May 23rd Closing Report
| May 23rd at 9am- ABSOLUTELY FANTASTIC Performance |
AS promised , we are set to OPEN much lower
Europe off 2% at 9am
Oil - 3.00 @ @ 97 - Ok, we need lower gas prices
Tornadoes wipe out anther town, Joplin, Mo. - OUCH !! - help those folks & the others
TOmrrow's open looks like it should be QUITE the OPPOSITE, not shown very clearly as
projected on the Charts Edge graph so here is tomrrows EKG START till about noon.
| May 24th at open, the rest of the day wont be available till tomorrow at 8:30am |
IT LOOKS LIKE ALL SELLERS TODAY- NO BUYERS
Like CE, ive also got an important pivot low on Wed about noon.
So far, as youve seen on the previous pages showing ENERGY for the week, Im not so confident
the mkt will continue with solid weakness as CE shows, but Ive WARNED about this entire week
since the MONTH projection was first published at the end of April.
more later
Jay
Sunday, May 22, 2011
Market Timing-Whats Next -May 22nd weekend report
NOTE THE CHART ON TOP- Just as I warned you in advance,
MONEY FLOW turned NEGATIVE on Friday's action, and now shows a 5th wave decline in progress.
Note also on Daneric's page, he has done a complete turnabout and is also warning of the potential to break under 1318 getting us to 1280 in a hurry, maybe even on Monday.
Energy Monday agrees with that outlook as you can see above, but do beware of a rebound rally starting
Tuesday right from the open, which could last till at least noon to 1pm b4 settling back again to complete
the wave on Wed where we have a pivot cycle convergence LOW at noon.
more later
Jay
Friday, May 20, 2011
Market Timing-Whats Next -May 19th additional charts
I used the graph from Danerics page to demonstrate a few things
1. IT follows the path laid out by the Elliott graph- expanded flat
2. THE 2 GREEN LINES APEX TODAY May 20th which emulates Alphie's chart, Jaywiz chart, and not shown, Spiral chart, ALL pointing to a HIGH on May 20th a BRADLEY date, and a day that has potent energy associations, noting the HYPE about the IPO for Linked in.
3. Just as the Elliott graph shows, we are reading the ENERGY for the next 10days till May 31st as very negative for stocks as well as human activities.
more later
Jay
Market Timing-Whats Next -May 19th wave report
UNLIKE the graph above indicating an expanded flat with the next big move as the MOST IMPORTANT
"C" wave due, imo, in the next 7 trading days as correlated to the energy descriptions that I will publish below.
Previously mentioned is the possibility for a run to just shy of 1370 today which would indicate as DANERIC has postulated could end the wedge, but he seems very reluctant to show anything like the above, thus giving the bull more credence at this time. Even with that, he shows any decline as muted.
just use my link on the main page to view his blog.
NOTE the MONEY FLOW chart above seems to show the potential for further deterioration in stock prices coming soon. Not the graph on the left shows waves 1,2 &3 down now making a 4th wave.
THe chart on the right shows just now anemic this rally from the 17th @ 1318 really is, and also emulates
the same wave count as the left.
THE DEBT limit issue has NOT even scratched the surface yet, and once it begins to get attention, it should become a greater problem for traders.
NOTE the FLOW of stock prices rather than the exact dates
HIS 20th low = 17th actual
next hill = May20th as we should see it today
note the next big move is DOWN till May 31st
| May 31st = BEST BUY OPP |
THE FLOW OF STOCK prices has been excellent following the Jaywiz chart above
ignore the 30th as its Memorial Day, but consider it June 1st, thus making the 31st the BEST BET for
an important pivot low.
MY CONCLUSION -This is NOT the TIME to lose sight of the MAY trend
Psych readings
Today = growth & success
Monday =difficult & severe moods
Tues = stressful & emotional imbalances
Wed= Obstacles & stubborn oppositon
Ths = DONT jump to conclusions
Fri = unyielding conditions & adversity
Tues 31st =mixed signals~~ tread water
Wed June 1st = Make agreements & comittments
Ths June 2nd = UPBEAT early but expect changes mid day
More later
Jay
its now almost 9am.
Market Timing-Whats Next -May 19th Morning report
| May 20th @ 7:30am |
Ive come to the conclusion that I build readership on CRASH TALK, and when Im moderate
about the mkt, it tends to drop off-- WHY IS THAT ?
A Simple answer= PEOPLE want to know WHEN.
In that case, I will IGNORE the END OF THE WORLD on May 21st.
and if it happens, none of us will know about the next day as there will be
no one to report what happened.
Today looks like a SEE SAW battle with the bullish side somewhat holding onto its gains.
SO what does this week do to the previous charts of the Elliott Expanding flat, and do we still expect a strong sell off next week? - The answer is YES , and YES.
Holding at or under 1350 to me is very telling as it shows the leg up off 1318 as a 4th wave within the triangle, meaning the next move is a 5th wave which should get back to 1290 at a minimum, or as low as 1250 making the may correction appear as a flat. SENTIMENT is NOW too strong to continue the bull trend. Until we get some build up of the negative sentiment, the bull cannot grow.
more later
Jay
Thursday, May 19, 2011
Market Timing-Whats Next -May 19th Closing report
| May 19 @ 8am |
That would change the wave count to an A-B& C wv low of 1318 on the 17th at 11:30am
Thus the next high looks like tomrrow afternoon, which could top out at the 1350 level
1370-1318=52pts
52X 50% = 26
1318+26=1344 which got didnt quite get hit at 1342
The above would change back to the original only if today drops to near 1300 by the close,
and at this time, that looks very doubtful, but a backdrop to a level near or above 1318 is very likely
Either way, a short term BUY would be llikely for tomrow's open thus heading back to a close at or near 1344 to 1350
52X 62% = 32+ 1318 = 1350
That would mean this ENTIRE correction Starting May 2nd would end as a FLAT thus matching
the PREVIOUS LOW of spx 1250, which would occur on May 27th and or 31st.
A FLAT as described above indicates the MKT has underlying strength and often occurs just prior to an extension or a 5th wave of the trend from the famous Mar9th low at 666.
Thus they could back to 1370 where the 78.6% retrace got hit on May 2nd.
An initial SPURT would be expected off the May 31st low at or near 1250, and even if STILL an expanded flat, the low would be expected at about the 1225 level.
Jay
note the AM futures holding steady at 1344, even with very good employment news
A late drop back to 1320-1325 would be within the wave structure above
after mkt notes
WILL THEY RUN TO 1370 from the open OR drop back to 1325 till 11am,
then recover to close at 1350
I would almost prefer a run to 1370 to conclude an ENDING diag triangle, but somehow
I just dont think thats the plan.
Either way, a decline next 10days could take the spx to1250
Jay
Wednesday, May 18, 2011
Market Timing-Whats Next -May 18th Closing report
| May 18th @ 8am |
The Previous page shows spx potential to make it to the 1300 level before popping in wave 4 on Friday
and Monday.
today's math seems to indicate a high at 1334
1359- 1318 wave 3of iii
____________________
now in wv 4 of iii as of the 1318 low at 11:30am
that gave the spx a decline of 41 pts matching wv 1 of iii, but Elliott rules in this structure would seem
to project 41x 1.618% = 66 pts
1370-66 = 1304
or
1359 - 66 = 1293
__________________
The 50 day MA is reported at 1323.50
was broken briefly yesterday
THE current wave structure is quite clear, at least to me, as the road map I published earlier this month
is working out quite well thus indicating a LOW on the 27th and or 31st with a huge rebound starting JUNE 1st.
Jay
Tuesday, May 17, 2011
Market Timing-Whats Next -May 18th prelim report
Graph above for Wave count
Power data graphs indicates a lower low is likely
energy is more positive, but that might come after the 180 bar pivot at 12:30
which does lead to a strong open Thsday
EKG so far indicates a higher open, but it did not reflect today's action expecting a lower close.
FRUSTRATING
Jay
Subscribe to:
Posts (Atom)