SPX trading
STRESS points are
Spt 27
Oct4
Nov 5
Nov 29
DEc 29
Jan 11& Feb 2
I havent spent much time on 2011 as yet, so cant comment on it without any study.
High points interspersed with above
SPT 30
Oct 20
Nov21
Dec17
Jan 4
Jan24
Jay
THE NEW JAYWIZ 2023

THE NEW JAYWIZ 2023
Thursday, September 23, 2010

More Detailed EKG for 23rd verses Wave
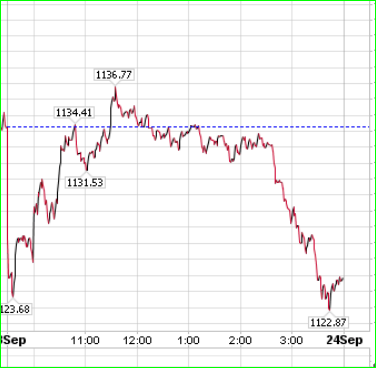 COMPARE to EKG below
Jay
 graph from Columbia's public charts
Shows me 5 wave s DOWN from 1148 to 1123 = wave 1
Now in a rebound wave 2 till later today, probably 3 legs a,b,c
The Spt 23rd DETAILED EKG shows it the same
WAVE 3 should hit late today and Early tomrrow
as previously posted till about 11am.
WAVE 4 should last almost all day after the open tomrrow
wave 5 of this leg should occur MONDAY @10 10am .
I had projected a much deeper cut on this leg,
but it doesn't look like it will be that way.
I had mentioned 2 different scenarios- one hard & fast,
the other long and tedious.
This idea indicates the BIAS now thru early Feb has a
number of sharp retreats interspersed with sharp rallies,
offsetting each other as we make our way to a Lower trading PIVOT
Jay

History lesson
PART of RRMAN's history lessson
The full moon occurs on September 23rd and Tishrei 25-28 will take place between October 3rd and October 6th. Thus, we are now about to enter the time of year most vulnerable to mass hysterias.
While historically autumnal panics have taken the form of financial crises, one might note above that the October 1962 Cuban Missile Crisis andOctober 1973 Yom Kippur Arab-Israeli War, the two points in history when the world came closest to an all-out East-West nuclear war as measured by NORAD's DEFCON nuclear alert level, occurred in the context of the typical seasonal pattern for mass panics. In 1962 the highest DEFCON status was reached on October 26th, or Tishrei 28. In 1973, the highest DEFCON nuclear alert was reached on October 24th, or Tishrei 28 as well in that year. (Tishrei 28 is October 6th this year.)
Some might not see the connection between financial crises and geopolitical crises, but it is clear that one exists. Consider, for instance, how reversals from psychologically important thousand marks in the DJIA have correlated with geopolitical "shocks".
One of the most clear-cut examples of this occurred with the October 1973 Yom Kippur Arab-Israeli War when, upon retesting the "Magic 1000" mark, the DJIA turned down in connection with the outbreak of war in the Middle East. What followed was an OPEC oil embargo against the West and a severe contraction in the global economy precipitating a 40%+ decline in stock prices in the ensuing months:
more later
Jay
The full moon occurs on September 23rd and Tishrei 25-28 will take place between October 3rd and October 6th. Thus, we are now about to enter the time of year most vulnerable to mass hysterias.
While historically autumnal panics have taken the form of financial crises, one might note above that the October 1962 Cuban Missile Crisis andOctober 1973 Yom Kippur Arab-Israeli War, the two points in history when the world came closest to an all-out East-West nuclear war as measured by NORAD's DEFCON nuclear alert level, occurred in the context of the typical seasonal pattern for mass panics. In 1962 the highest DEFCON status was reached on October 26th, or Tishrei 28. In 1973, the highest DEFCON nuclear alert was reached on October 24th, or Tishrei 28 as well in that year. (Tishrei 28 is October 6th this year.)
Some might not see the connection between financial crises and geopolitical crises, but it is clear that one exists. Consider, for instance, how reversals from psychologically important thousand marks in the DJIA have correlated with geopolitical "shocks".
One of the most clear-cut examples of this occurred with the October 1973 Yom Kippur Arab-Israeli War when, upon retesting the "Magic 1000" mark, the DJIA turned down in connection with the outbreak of war in the Middle East. What followed was an OPEC oil embargo against the West and a severe contraction in the global economy precipitating a 40%+ decline in stock prices in the ensuing months:
more later
Jay
SPT 23rd EKG & commentary
 FYI- I thought this might be important to see NOW
PRELIM EKG For Friday morning - see the above graph
Jay
 yesterday was an 8 day high, but one day late for the averages,
 and yet is might work out.
MY proprietary ADv- decl & vol ratios are way off the highs of SPT 9th and yet the price
of the mkt ran higher till Tuesday on WANING internals- What does that say about the TRUE strength of the mkt-- IMO<>
In view of RRMAN's history lesson concerning Oct6th THIS year
I had already proposed a decline starting this week, but ENDING temporarily on
OCTOBER 4th
Also we read that the next 100 days is marked with UNCERTAINTY
as the planets are clustered in the southern hemisphere-
supposedly a negative for human emotions & stock prices
OFF TOPIC, somewhat-
Maybe thats why the GOP wants to shut down our NATIONAL Govt and create havok
remember the reading of Tuesday-- Jarring & disruptive to CREATE HAVOK-
and so it might come to pass--- but I hope not, and I'm sure no one else, even those
that propose it, would like to see happen in reality.
Stressed FULL moon all day today
Jobless claims some what negative adds to the selling pressure
126BARS @ 4pm and or open tomrrow should lead to a lower open tomrow
along with
62%/ 13 day at 11:13
156bars at 11:30am
Neg energy at 10;30
DAILY hourly turn @ 11am
EARLY EKG reading shows sharply lower open
one reading for tomrrow also indicates early confusion
According to Monday's reading, the mkt should open lower and recover during the day
How do we anticipate our positions? with this knowledge is the next question.
I COULD PLAN to close out shorts my Friday AM,
Possibly sell the close for a scalp trade on Monday's open - but thats really high risk
_____________
Once in the clear tomrrow AM, It might be an advantage to watch and wait for
Monday's lower open to possibly buy long as the next HIGH turn is not expected
until the 30th @ 1pm
_________________________________
As members of this community, I expect all of you to add your trading expertise
as the mkt makes important levels when your indicators give you readings to share.
Much thanks
Jay
Wednesday, September 22, 2010

Tuesday, September 21, 2010
Power Graph, Week of Spt 24th & 27th
 NOTE on 23rd- LOOKS LIKE 22nd & 23rd maybe reversed
I should have published this on Sunday as it more clearly shows the CHANGE occurring after today
I Hate the idea of HOLDING over a wkend, but the graph and reading indicate
a LOWER open on Monday, Spt 27th, but it does give us choices.
I know Im putting the CART in front of the HORSE since NOTHING has happened
yet, so I'll wait to suggest what I would like to do on Friday, GIVEN the above comes to fruition
PS
The previous week power graph worked out quite well- obviously not 100%
but in general it did depict the daily mkt moves with decent accuracy
ITS NOW 3:30 and I think they've SHOT the works
disparity of SPX much less than DOW leading the overall mkt lower
They just had to over ride 1130 and get to 1150, almost -- exactly@ 1148.59
which adds up to the next higher level of 5
1+1+4+8 = 14 = 5
SPX heading lower at 3:35pm @ 1139.43 with still 25 minutes to go
I have NO idea why the FED hype would indicate a strong market
for anyone to buy into -- HYPE -HYPE - HYPE
FED said the economy sucks and they stand ready to apply more aid.
DUHH; doesnt that mean the economy is in deep doodoo
WHO would buy into that ?? retail buyers??
SIGNS of DISTRIBUTION
Last minute buyers who think they missed the rally -
Isnt that what makes a FIFTH WAVE??
204bars at 2PM CYCLED in right at FED time= pivot low
228bars @ 4pm and or open tomrrow
JAY
Spt 21st EKG - & end of day comparison
 NEARLY PERFECT - STILL at 70%, and I dont really expect it to get any better than that
Jay
 Looks about the same as yesterday
26 hours at 10am
Yesterday was perfect feel good day
new Wall St movie premiere
Headline News - recession ended in 2009
Pres town hall meeting on National TV
tomrrow is Autumn Equinox, often a turn date
23rd of month = 5 = CHANGE, can by off by a day in either direction
38%/13 day cycle at 10:42am
228bars at 4pm
Jay
Monday, September 20, 2010
Spt 20th EKG & comments
 MY proprietary ADV decl & volume indicators are screaming SELL
their LEVELS TODAY are woefully lower than the levels they reached on SPT9th
Jay
 As previously indicated
TODAY has little value for anyone
expect to put on the finishing touches
All of the data previously eminated from this site is about to come to fruition
Nothing anyone can say or do can change the course of events about to unfold - WHATEVER they may be
Obviously whatever happens will not be armagedon, but will have an impact none the less
As the Monday Spt27th read says- dont believe what you hear & read as SENTIMENT will go to an extreme negative.
its an OLD OLD STORY
When the Media is screaming disaster, its time to be contrary
Jay
Sunday, September 19, 2010
Elliott wave Graph from Part of NY
 No one can really know when this wave will end but the evidence suggests there could be a break this week.
It's the week after options Exp
it's the 20th of the month & last 10 days
Nearly every month since March 9th, 2009, the mkt has made lows at the first of each month and highs at or near the 20th of each month, and dropped off in the last 10 days
WILL that pattern be repeated?
This week
Monday calls for HIGH Expectations and we have a PRES speech emulating
__irrational exuberance, Maybe ??
Tuesday indicates something is out of control, havok, eruptive showdowns
What will it be & will that have any effect on trading ??
WEd
Unsettled, stumbling blocks
Thsday
Financial warning bells
expect CHANGE - FOR THE WORSE
Friday
Disagreements & poor communications
Illusionary truth
Monday 27th - DONT BELIEVE everything you hear or read
If we get a strong sell off, the NEG sentiment & RHETORIC will be RAMPANT
by Monday , the WORLD will be coming to an END--
See Monday's warning- DONT BELIEVE IT
Jay
Thursday, September 16, 2010
SPT 17th SNEAK PEEK & Update
 NOT great, but not too bad either- could count it either way
Jay
 Heres a MORE complete view of today's EKG
SPX 1130 was at the top of the futures earlier, but now at 9am is waning some
CNBC hopefuls looking for break outs - glad to hear it-
everytime they profess a mkt slide---you can be sure its going the other way
Jay
Jaywiz index was .26 yesterday which is more bearish than it has reported for some weeks
PC ratios also 80% bearish for 4th day in a row
Power graph showed the day making a low intraday
possible times
neg energy at 11;41am
30bars at 12:30
60bars @ 3:00 pm
This year it seems to say
Buy RoshHashanah & Sell Yom Kippur- opposite to generally known predictions
In addition to Jupiter's general aptitude for money , expansion & good luck;
it is making its CLOSEST pass to Earth till 2022
Jay
 JUSt as projected by the POWER index, we see the DAILY EKG confirming TOMRROW
CYCLE converge at 10am
SHARP DOWN open followed by renewed UPSIDE
DID anyone see that BIG put OPTION buy yet as there was LAST MONTH
on the day b4 expiration ?
Jay
Wednesday, September 15, 2010
SPT 16th PRELIM - EKG & UPDATE
 For comparison, we can see the OBV not keeping pace with the rise in stock prices at he end of the day. And so far the AM futures indicate an open at 1130 prior to 8:30.
 Once again we see the PROBLEM associated with the CLOSE of the day verses the data STREAM which is continuous- WHERE to cut if off ??
Today was obviously NOT portrayed very well, and now we wait for 9:30 to publish
the 17th OVER the sneak preview
Jay
 As we can see, the end of day today "" SHOULD"" sell off into tomorrow at 10am as the SNEAK PREVIEW indicates - Jay
 Late sell off is indicated leading to a LOWER OPEN on Friday
FRIDAY
Friday has a 10am has convergence
of
13hr pivot low
&
258Bars = 21 hr cycle pivot
Jay
Spt 15th EKG
 OK AGAIN
Tommrow should make it to that MAGIC 1130 number
Once there, I will be looking for a short, maybe between 2pm & 4pm.
Jay
 Let me KNOW if you want me to continue with the DAILY EKG
It seems to be quite valuable for those who trade daily
but if your not getting anything from it, then why bother
39hrs at 10am
126bars@noon
156 bars @ 2:00pm
Pos energy at 10am
Neg energy @ 2:17 And 2:52pm
Today calls for mid day low, possibly at 2 to 3pm
and late afternoon shift
Tomrrow calls for a tranquil day
but dont make any biz decisions
Friday calls for early difficulties - better later
Jay
Tuesday, September 14, 2010
SPT 14th EKG & comments
 Couldnt ask for anything better
 Today's cycles
13 day cycle pivot at 11am -- would normally add support for a later day recovery
the SELL off late day MIGHT be more appropriate for TOMRROW AM/OPEN
30bars at 10:30am
60bars at 1pm
90bars at 3;30pm
From the above, we would expect a bias to move lower most of the morning till at least 11am
retail sales data - non event
today's read calls for $$ stress
and a good day to lay low
Jay
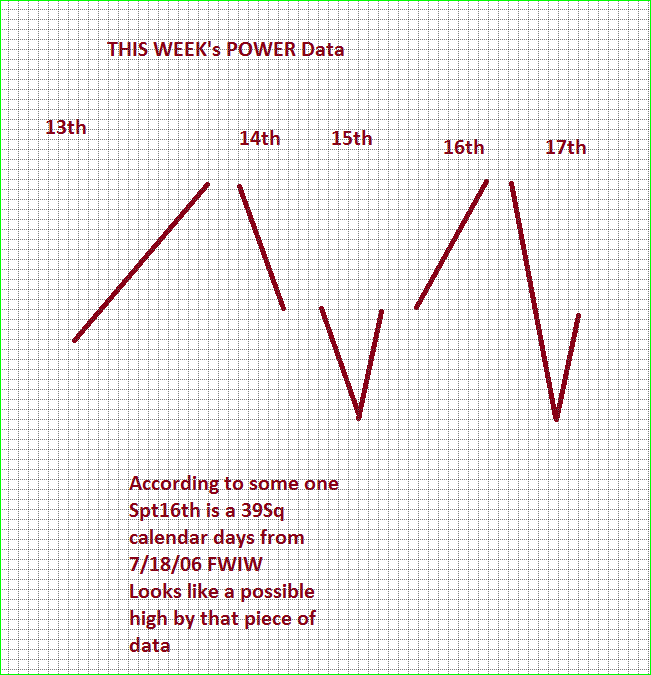
Spt 13 to 17th POWER Data Graph
 NOT EXACT, but how could anyone expect 100%
but quite a good representation of the week's trading
Jay
 Some one suggested that BECAUSE we have not seen a 20% sell off as of Spt 13th,
IT WONT HAPPEN
WELL: DONT YOU BELIEVE THAT !!
THE WAVE structure as COLUMBIA had shown on his blog public charts as well as some others point it out as a distinct possibility.
Using the principle of WAVE equality,
we had an spx 210 pts loss from April 26th to July 1st
That would equate to a 210 pts loss from the current high of 1120 = spx 910
researching the ENERGY about to unfold in the next 3 weeks thru Oct4th indicates
that SUCH a sell off is POSSIBLE within this time frame
Jay
Monday, September 13, 2010
Update Spt 13th
 Ive seen a similar chart at another site which also shows what some are labeling as wave 2
about to finish *shortly , and or wave X as ive labeled it.
*Shortly -could be at 10am today at the 26 HOUR cycle
Merc direct Sunday adds to today's boost,
and the futures this are positive to 1114 as I write this at 8:30am
The BRADLEY date appears to be turning in its HIGH today
as it was officially posted for Saturday
Once wave 2 - or wave X as I described is finished we can get 2 different results
1. can be an extended and lengthy decline over many weeks or months
OR
2. a QUICK sell off as Ive previously described due to the neg cluster of energy
from the 20th to Oct 4th.
IMO,
Door # 2 seems most APT to occur given the NATURE of the
WAVES we have already seen and are about to finish today
A FLAT at SPX 1120 area sets up one of the weakest wave structures indicating the
next wave becomes a THRUST lower matching the price decline of the FIRST major wave.
its called WAVE Equality
That would take the SPX down about 210 pts to 255 pts to SPX 910 at a minimum
and 875 as potential maximum
Sunday, September 12, 2010
Where is that ILLUSIVE Crash ??
 Is there REALLY going to be any set back, ??
or are we to suppose the moon is waiting for a landing ??
the Wave seems to be HOLDING ON FOR DEAR LIFE as we Mark time
everything happens in its OWN time, not according to what we would want
But we have taken on the task of determining when there will most likely be
serious sell off to the current trend- WE have NO idea WHY it would happen,
as that only becomes clear AFTER the fact.
We had already reached a 62% retrace {{555pts}} of the 08/09
loss of 900 pts at spx 1220
AND on JULY 1st they gave back 38.2% to spx 1010
NOW we see the SPX hitting the 1110 level last week which = a 78% retrace from 1010 -1130
Yes its possible to reach a little higher up to 1130 next week.
AND
We are at a BRADLEY turn date on the 11th which could easily hit on Monday, Spt 13th.
From there, the next Bradley date is OCT 1st
which coincides with a cluster of negative energy
Using FIBO math which has been discussed b4,
we can guess that the next important level would also be
62% of 555 = 344 pts taking the spx from 1220 to 875
Columbia's chart above shows that FIBO level
SINCE we are now at 1110, that would represent a loss of 255 pts
The NEXT QUESTION, of course is WHEN.
There are TWO HEAVY Negative ENERGY clusters coming up
first series from SPT 20 to 24th
Second series from Spt 30 to Oct4th
IMO, TIME & PRICE should converge as indicated above &
There is a possibility that one of those days would occur with loss of 1000 dow points -
most likely SPT 23rd.
Jay
Friday, September 10, 2010
Spt 10th EKG & later commentary
 Didnt finish as low as pictured, but I really didnt expect it to, unless Monday
starts out that way to finish. If trading were on Saturday, the down leg went further.
otherwise, its a good pre visualization of the day ahead
Jay
 Much to do about nothing
near repeat of yesterday
We mentioned spx 1110 as strong resistance at the 78% retrace level
1130 is 100%, and that still does have potential
Just in case they do move higher, that does NOT indicate a NEW BULL RUN
mainly because there can be an X wave higher in whats called an irregular wave;
this type of wave CAN also indicate a severe sell off immediately upon completion
be that Today, Monday or SPT 20th
Jay
NO EKG today
Too much confusion- cant get a good reading yet as of 8:30
it it changes
I'll publish later
thanks
Jay
it it changes
I'll publish later
thanks
Jay
Thursday, September 09, 2010
Spt 9th EKG
 60bars at 11am
90 bars at 1:30
120bars at 4pm
Futures opening higher on jobs, etc
energy low at 1:10 pm
Jay
Wednesday, September 08, 2010
Spt 8th EKG & end of day update
 Couldn't ask for a better depiction of today's action
The OBV at days end appears like the open should sell off
And the energy atmosphere till about 1pm is moderately negative
BUT the EKG is not very negative.
POWER INDEX shows
a LOW tomorrow - Thsday
Fri Flat
Monday UP
Down on Tuesday
 Looks like today is day ON HOLD
258bars at 12;30
Neg energy at 1:30
could be the lod as shown above
End of day does not have to close lower, but there is some disruptive energy at 4;24pm
IF the EOD does end lower, then there is an over ride of the 258 bar /21hr low leading us look for the next 21hr cycle to head lower
Jay
Subscribe to:
Posts (Atom)