
 Notice the EKG chart just below this line conforms much better to the actual event IT simply becomes a matter of WHEN I cut off the data, and thats based on my own thoughts at 8:30am as to what the day might look like when done. ITs not the FAULT of the EKG data, only the interpreter, which is similar in nature to any technical or system analysis tool.  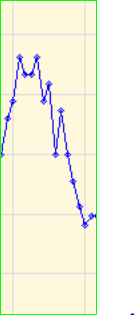 |
| May 31st @ 8:45am |

Power data shows potential for higher open as we see from the spx futures
but what happens afterward
1370-1312= 58pts
58 X 62% = 36 + 1312 = 1348 potential
I did publish a series of price levels b4 based on the 58 pt drop.
Previous projections indicated May 31st as a low with subsequent rebounds.
That projection appears to need adjusting depending on HOW long spx 1348 stays on the boards.
If 258 bars & neg energy at 10am produces only a minor dip off the open high,
then we could consider higher afterward as a normal consequence of the 258 bar pivot.
There are other reasons to be bearish overall since May 2nd and as soon as this downtrend
ends at the 1296 level or lower, it still looks like JUNE-JULY & till Aug8th has bullish potential
AS a WAVE "4" off 1312 low as wave "3" weve seen rebounds as high as 78.6%, and have offered
those levels as potential targets. that does not guarantee we will see those levels
Others have indicated mid day highs at or near the 1350 level today, before selling off from there.
Check out the LINKS on the main page to get other views of this up move from 1312.
and just what the alternatives show.
Jay
IT looks like that LOW on May 24th at 1312 shown on the qtrly graph as May31st has already occured.
Thus we need to adjust our thinking & outlook to reflect that possibility.
The graph then shows a HIGH on what is still indicated for June1st, or it could be May31st- just the
opposite of my prognostications. SO we need to be vigilant of the possible directional moves this week, after reaching that peak either today and or tomorrow.
I dont hedge or get wishy washy saying if this happens or if that happens then we get-------.
BUT as indicated, adjustments are quick and up to the moment given fresh data.
Jay
4 comments:
The DOW futures are up 105. The S&P and NASDAQ are also up in the stratosphere. What's that all about?
A lot of back and forth went on this weekend over in Europe as all the solvent nations ( meaning Germany) flip flopped again and now want to bail out Greece with more loans before they go belly up in Mid July for lack of funds. The saddest part of that.. is that the only reason the futures are up so much is because this caused the Euro to bounce and the dollar to fade.
Just this morning I was listening to a news broadcast while taking my son to school. Evidently Moody's is considering lowering Japans credit rating over bulging debt and a slowing economy. Consider the lunacy of what we're witness to here .. the futures are on fire because the only solvent nation in Europe is once again demanding it's citizens work hard and bail out club Med.. and meanwhile the next biggest economy on earth is close to being debt downgraded. It's more Alice in Wonderland.
Yes I took DIA at 124.19 w/ stop at 123.74 last TH.
Even with this strong upmove off 1312 on the 24th there are many techs who still hold onto the bearish view, and June 24th has been projected by some for a low of this bear trend that started May 2nd. Maybe then we can get wildly bullish again.
1370-1312= 58pts
58x 62% = 36 + 1312 = 1348
there were 5 waves from 1312 to 1344.75 this AM.
what does that mean?
Was that the TOP or is there more coming- Daneric has posted a few scenarios worth looking at as well as trendsx3
I was WILLING TO get VERY BULLISH if we settled down to 1296 TODAY, but that appears OUT OF THE QUESTION for now.
SO what do we have as of today?
good question, lets explore before we get too far off track.
WE did see 5 waves down from 1370 to 1312- Label as possible {A} wave low.
we now hit a high with a 5 wave run to 1344.75- Label as possible {B} OR a of {B}
b of {B} next backs off.
Personally, I get very skeptical about a mkt that THRUSTS to an OPEN high, and loses steam as the day progresses.
How Low? If we are in a 3 wave a-b-c for {B} uptrend thru the 8th, then
we might see support at 1327 using fibo math on or about the 3rd & or 6th.- so we should now see the daily range tighten a bit in between 1312 & 1345.
J
Post a Comment