THE NEW JAYWIZ 2023

THE NEW JAYWIZ 2023
THE NEW JAYWIZ 2023

Wednesday, October 27, 2010

EKG w after hours display for comparison


This is the EKG with a continuation for AFTER HOURS,
or what looks like it might have been after hours, and we know NOW that it
was during the day for a rebound after 1pm @ 156bar pivot, and the 3pm pivot at 180 bars only accentuated the move up.

The open is easier to judge as I wait for 8:30 to see any reaction to any data
but the close is not that way. I have to JUDGE when to cut off the graph since the data is on a CONTINUOUS feed which makes the close much more difficult to judge.
Jay


13hours at 10am along with 120 bar cycle pivot
or
126bars at 10:30 along with some mild neg energy

So far the TECH, WAVE , CYCLE & energy are in sync
scroll down to view the previous pages showing the
McClellan graph, DOLLAR graph, EDT graph, and more

Yesterday's close rebounded off the 2pm pivot
today we have 180 bars at 3pm, so we will have to see
if any rebound repeats off that pivot.

Jay

Tuesday, October 26, 2010

FROM ELWAVE Rider


MATCHING these charts with MY OUTLOOK
makes a Very STRONG CASE
for the BEAR to attack tomorrow

The READING calls for CHAOS
Morning complications & Disruptions

Jay

UPDATE for OCT 26th

Not bad, just missed a small rise from the 2pm low which was mentioned in comments
as a 90 bar cycle pivot, and it lead to a 3:30 high, a little after the mentioned
3pm possible high, so over all, not perfect, but NOT bad either.

Jay
Money talks get poor reception today

problems abound

SPX Futures indicate a lower open - off 5.80

Neg energy at noon
pos energy at 3pm
neg energy after hours

Activity index weak at 200 level all night
Flux a little quiet today
90bars at 2pm

Breaking support today would setup tomrrow's CALL FOR CHAOS

Jay

Monday, October 25, 2010

Update- EDT

Chart from ELWAVE rider

shows and explains very clearly what we've been watching unfold since
October 4th

it indicates an EXHAUSTION of the uptrend, complete with an overlap of wave 2, and an overthrow of wave 5 as of this morning at open

the AFTER effect can extend a sell off for many months

OR
HIT immediately erasing all of the previous gains within a brief time period
and fall back to the point where it began.

Jay

70% Accuracry since March 24th

Another very successful EKG
STill holding 70% , but I dont expect it to get any better than that
even the days that dont make it are usually some what close to actual,
but we have seen some fail miserably- those days are now far & few between

Jay
Nothing dangerous about this chart today as it shows.
There is a chance the close could be accelerated lower.
Tomorrow's EKG starts lower right from the open.

as previously indicated a HIGHER open to touch 1189

Today is a Bradley turn date

258bars (21hrs) at 1pm

Jay

Sunday, October 24, 2010

McClellan NEAR ZERO with SPX at recovery HIGHS

Compare the above Graph Oct 22nd to APRIL 26th, 2010
the McCLellan Osc is AT the ZERO LINE, while STOCKS are at
recovery HIGHS- what does that say about the sustainability
of this market- IT SAYS EXTREME CAUTION is warranted

Jay
Compare the ABOVE Current level and position to
OCTOBER 2008, just before the big declines

Jay

Saturday, October 23, 2010

DOLLAR UP

Certainly looks like it wants to rally

Jay

Daily Readings

Monday -Oct25th
expect many problems
money talks dont go well
unwelcome events

Tuesday -26th
Disruptions
prefer solitude
solve some problems today
unrealistic expectations

Wed
Plans disintegrate
morning complications
Disruptions & chaos

Thsday
IN like a LION
OUT like a LAMB

Fri
Pleasant & Fun day

more later
Jay

Friday, October 22, 2010

Oct 22 EKG & AM comments

NOt bad
NO IMPROVEMENT - sure was none
Jay
Even tho the graph shows a late rally higher, it doesn't not have to occur that way, just as yesterday did recover off the 2pm low, but did not make higher highs.

The NUMBER of ASTUTE market analysts are NOW calling for an immediate TOP, and drop

Evidence is gaining sending warnings to certain groups of elite traders

Is it real or memorex? [g]

FULL moon tonight might STILL be holding this baby in tack

Elections more in focus than stocks?

Wave has made a series of 3's since Oct 12th, and yet it is still in a possible expanding wedge
w one more high, otherwise it would be plunging in the retrace wave, and its NOT happening

more later
Jay

Thursday, October 21, 2010

Oct 21st EKG- BULL GRIP

DAMN good for sure
Jay

Is the BULL GRIP slipping ??

Are bears yelling WOLF, once too often, or is this the REAL thing when the BEARS are ready to throw in the towel--- I CANT TAKE IT ANY MORE !!
which works at both end of the spectrum- { bulls at bottoms & bears at tops}
CONTRARY thought- mkt forces you into it.

Futures waning off the earlier AM highs at 9am

Power data shows up, dn, up

Neg energy at 11:11am
90bars at noon
126b @ 3pm

One of my sources indicates the 28th as the more important pivot low
as it also showed oct4th as the pivot low for early Oct.

That rally shown on the EKG after NOON, does not have to be a higher one

charts on the dollar indicating the LOW has been hit which would have been
@ 76.20 on the 15th

One source indicates an ODD lot sell signal was triggered Monday

ROLLING TOP ?
GOLD high last week
Dollar low last week
Stocks high this week

more later
Jay

Wednesday, October 20, 2010

Oct 20th EKG & AM commentary & closing

NOT quite as good as yesterday, but still showed the trend for the day
Jay
Yesterday's EKG was as good a gold.
will today be a repeat performance?

Today we have a convergence at 11am of the bar cycles{ 21hrs} & 13 day pivots
as shown above

It should lead to an afternoon rebound till 3:30pm
as shown above

Power data indicates a good start but retreating the rest of the day which is somewhat contrary to the EKG but not entirely

CNBC commentator telling the public that stocks are CHEAP, of course in relative terms, but we ALL know the stock market stretches evaluations in both directions.

Just as they got over bot for many months in 2007, they can get oversold for many months
also, and look cheap. Where was his recommendations on March 9th, 2009 ??
Anyway.
IMO there were many holes in his argument, but he is obviously attempting to attract buyers.
Its the OLD argument that IF you buy and hold for a long enuf time, your values will increase.
BUT then again, stock market has not made sufficient gains since year 2000
10 years of apathy.

SO<>

Watch what happens in the politico arena IF we get a substantial decline in the next 10days
They, whoever they is, will be screaming- MR PRESIDENT !!- DO MORE TO HELP
what are you waiting for? another crash ??

more later
Jay


Tuesday, October 19, 2010

October 19th EKG & AM comments

NOW THAT'S more LIKE the EKG we've all come to LOVE
Sometimes, there is a ROLL OVER at the EOD into the next morning
and it looks like yesterday's EKG may have reflected that

Jay


Tuesday. today is scheduled to sell off as previously mentioned

Was yesterday an 5th wave EDT ?

Yesterday's outlook as published-- HOLD off & Dont risk $$

Today outlook= Unexpected disruptions & expenses
today is a PHI cluster date according to one subscriber- Lucas series

hmm -70% chance of rain today- fwiw ??

Activity index yesterday AM low was 66, mid day high 233, and ended at 100
Today was at 266 at 6am, at 9am is now dropping lower to 133

FLUX very active last week was QUIET yesterday, but TODAY is highly active again

Ok, I know what your thinking
morning sell off and then back to biz
B of A earns improving losses, so we should NOW buy it- hmm
where were you when it was trading at $4. Dont touch it- hah

180 day lo to lo -- Feb8
360 day high to lo -- 9/3/08
convergence of cycles on Friday

Full moon Friday late day indicates finding a balance & financial improvement
13 day cycle segment at 10:20
Neg energy at 11:35
156 bars at 11am

Jay

Monday, October 18, 2010

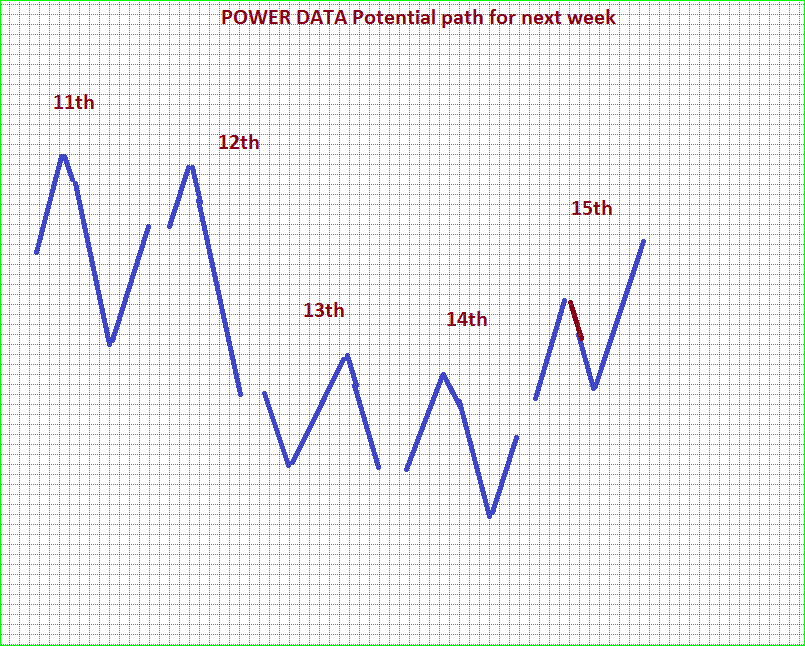
Power Graph, Week of Oct 22nd


Lets see if the REVAMPED data graph can perform
better than 50% on a weekly basis

Jay

October 18th EKG

TODAY was a TOTAL BUST - NOTHING even CLOSE
STILL HOLDING 70% accuracy, but today was NO help
Jay
Today calls for being practical
dont take risks with $

A FOG of UNCERTAINTY rolls in over wall st now

Bars cycle pivots
90 @ 10am
126 @ 1pm
156 @ 3:30

Power data graph shows strong down day for TOMRROW

Looks like Friday's selective selling my expand to other sectors

Jay

Sunday, October 17, 2010

BEAR Market- WHEN ?

HAS any read this report from EXCEPTIONAL BEAR

www.exceptional-bear.com

IMO, His assumptions maybe correct, but his timing may be wrong

He attributes a crash to FED intervention FAILURE of QE2

Market doesn't care about FED intervention unless its in response to markets such as in 2009, BUT it is my assumption the market would have recovered on its own with or without the FED

I was wondering WHY I have NOV 4th as a Bradley date, IMPORTANT BOTTOM & IMPORTANT TURN HIGHER thru Late Nov and continuing till late Jan, 2011
before repeating the decline of March 2009.


THE TURN occurs the NEXT day after NOV 3rd and supposed FED announce of QE2 - so the initial reaction, IMO, WILL be viewed as INADEQUATE

At this point in time, some will say a CRASH is possible NOV 3rd or 4th, but NOV is targeted for a MARKET rally.

HIGH anticipations and VERY HIGH POSITIVE Sentiment can DISSOLVE in seconds during the next few days leading to the NOV 4th bottom

Jay

Friday, October 15, 2010

october - Helge & Lavoie


BOTH charts SEEM To be pointing DIRECTLY at Oct 27-28 as ALSO reflected by
Mahendra's projection for the same date

the next question is when does it start,
since we seem to have a handle on when it ends.

altho Nov 4th potential for secondary pivot is not shown.

Its possible we dont see anything serious until Oct 21st to 28th
or it may have already started

Regardless of Googles meteoric rise today, IF it wasnt up as much the NASDQ would NOT be up 22 pts at 2pm, and even at that, the Dow & spx are showing true colors

Looking for a trading pattern? check out the EKG daily
wish I could get the power graph to perform better,
but its from a very different source

Lavoie's graph shows high may have hit on WED, and the SPX did hit 1184.27 @ 2:15pm

Helge's graphs are harder to pinpoint and the top may have already occurred
but which looks like the 9th, which matches Spiral Cal date of the 10th.

ENERGY totally CHANGES after this WEEKEND
NEGATIVE ENERGY forces are in much great abundance
with very little positive influence interspersed thru Oct 28th.

Just what that means in terms of a price erosion is only a guess
some say maybe 5% & others indicate as much as 25%

Jay

EKG October 15th & 4pm comparison

REALLY DARN GOOD
STILL HOLDING 70% average accuracy over the past 6 months
inception was March 24th, 2010
Jay
Early power boost

Fed spoke at 8:30am

78.6% /13 day at 12;25pm

end of day might not retreat as ekg shows

Jay

Thursday, October 14, 2010

EKG October 14th & closing update

GOT THAT ONE NEARLY EXACT
Still holding at 70% daily accuracy since March 24th inception
Jay
Running a little late today- its 9:45am

Neg energy at 1:57pm
228bars @ 1pm
258bars @ 3;30pm

Uncertain morning
look for bargains mid day

Tomrrow am calls for energy boost

Jay

Wednesday, October 13, 2010

TIME & PRICE LIMITS

1173 .68 was the PRICE level prior to the May6th FLASH CRASH

got above that on open

1175 is next 5 level --1+1+7+5 = 14 = 5-- a CHANGE #
1179 is next 9 level-- 1+1+7+9= 18 = 9 --a FINAL #

Looks like 1175 might be the winner unless 10am make a higher high,
but the open could be the 13hr cycle high

Jay
ps
GREAT charts, thanks- Michael @ Columbia 1

BULLS STILL CHARGE- EKG oct 13

ONCE AGAIN we published the EKG below at 8:30am
and COMPARE with the SPx at the end of the day
Jay
STILL holding 70% ACCURACY
13 hour Cycle @ 10am might provide the hod today

Some backing off till mi day tomrrow- thsday

but Friday has the power to surge ahead

POSTIVE enrgy is CONCENTRATED this wkend and dissolves
by Monday morning where a fog of uncertainty takes over next week

ps
Isnt it preposterous the Republicans like Dick Army can get on a
public forum, and blame TARP on the Democrats.
Then tell the world that BA, Meryll, and Citi should have been
allowed to fail, when it was his party that saved them.

Its one thing to ignore the DOT COM bubble, and allow that to sort itself out,
but to claim the govt should have allowed CHAOS in the GLOBAL FINANCIAL world is just irresponsible, IMO.

and that rhetoric is simply POLITICALLY MOTIVATED

Jay


Tuesday, October 12, 2010

SPIRAL chart

SPIRAL Cal CONVERGENCE date is OCTOBER 10th, but that was good for 2007

but I KNOW SOMETHING HE DOESN'T

THIS YEAR it is OCTOBER 15th
MULTIPLE HIGH ENERGY CONVERGENCES THIS WEEKEND

NEXT WEEK WILL BE A SHOCKER
MULTIPLE NEG ENERGY CLUSTER + that cycle
convergence I have mentioned several times on 21 & 22


Jay

Oct 12th EKG

WOW- Darn good for sure
Jay
the reading indicates a change today, but it might take one more day b4 we see any price changes worth noting

55%/13 day at 11:59
60bars at noon
Could be the lod

I mentioned the FLUX indicator b4
It was showing VERY STRONG activity ALL of Jan, Feb till March 13th of 2009
as well as sporadic activity in 2008.

It has had Little or no activity since then, except for most recently on
June 26 ,27, 28 & we got JULY 2 to 9 lows
Aug 4th
Spt 2nd

and now IT HAS NOW BEEN VERY STRONG every day since OCT5th
IMO, as IVE recorded this phenomena, it occurs when we can expect serious price changes,
and I dont mean bullish changes.

Note the important cycles coming on Oct 21 & 22nd
500 tr days from oct27th, 2008
411 tr days from Mar9th 9th, 2009

Jay

Monday, October 11, 2010

HOW to SPARK the R E mkt

Anyone older than 50 who has bot and sold a few homes in the past 40 years would be able to tell the Fed what to do to get the Real Estate mkt moving again

The Economy and the RE mkt is near death- WHY ? because people who need $ for a mtge cant get it from the banks, and those who have $ to buy are waiting for lower prices or getting extras that would not normally be available to them;

STALLING Now has benefits

Its just the opposite of the FRENZY when sellers were getting top dollar PLUS
and buyers were paying a premium because they intended to FLIP the property within 6 months;
BUT THAT SHIP HAS SAILED and wont be back for many a day, month, year, decade.

Its really very simple
What makes people ACT = FEAR of course
FEAR OF WHAT
HIGHER INTEREST RATES would be ONE good reason to buy now.
Prices wont recover until a bunch of homes are sold and the tide begins to turn

BUT - will the Fed raise rates -- NO-- UH-UH
why, because Ben is a student of the great depression and HIS FEAR is creating
another one. He would rather be remembered as the savior of the US economy

So, the market drags out TIME as we approach that 70 year cycle in 2012

Anyone who has bot homes over the past 40 years has seen home selling increase as interest rates rise- very simple- based on fear, people want to pay less interest.
I dont remember the exact time periods, ((1980's, for one)) but I do remember thinking about not wanting paying a higher rate and not wanting to wait as rates were in a rising trend.

Jay

REMEMBER GOLD

this was gold a couple weeks ago at 1300
Internals DIVERGE as price climbs

Hadik expects 1370 price high & late October low

Anyone got an updated chart- email it to me and I will publish here

Jay

Oct 11th EKG & readings

ONE MORE HIGHER THRUST Tomrow at OPEN
then we make a LOW on WED at about 1pm
HOW LOW ?
Dont know, and cant even guess
Jay

Today calls for vitality & success, should make for a higher day

Activity index @ 9am hits an amazing HIGH of 500
has been quite low for many weeks at or near the 100 level

Power data shows today open higher, and attempt to stay at those levels
and so far the 1168.78 meets my projection for a failure under 1170

the EKG rising later does not mean the spx has to supercede
the 10am high and it really shouldn't.

Another banking crisis due to inability to FORECLOSE ??
doesnt seem to make sense?? but it might clog up the works,
if it lasts a month or more

VIX now under 20

Tuesday
Yesterday's UPBEAT mood CHANGES
expect disruptions

Wed
Early problems
challenging - obstacles & setbacks

Thsday
Look for bargains MID Day

Friday
POWER BOOST

Monday 18th
DONT RISK $$

Tues 19th
Disruptions

Wed 20th
expect some success

Thsday 21st
PROBLEMS & Struggles
expect a difficult day

Friday 22nd
UNSTEADY
return to common sense mid afternoon

Jay

Saturday, October 09, 2010

1937-1942 Graph

COMPARE with 2007 to 2012

Ive made a possible comparison of April1940 peak & decline
to OCTOBER 22nd, if you can read it above

Jay

Power Graph, Week of Oct 11th

Weve been WAITING for a trend change since about SPT 20th,
but it seems to be like the energizer bunny

Monday's outlook at 39 hours at open till 10am,
along with the daily read & power graph
ALL seem to indicate ONE more thrust to maybe 1170

Once we see lower highs & lower lows starting to take effect we can be more certain
the trend has changed.

From the energy & power data graph, it would appear next week might show us
the way into that new trend

the new moon on the 8th did indicate a change

The Chart above from Michael at Columbia is not labeled,
but does seem to show 5 waves nearly complete from that low at 1051.

Since nothing serious is expected till the week after, we will remain vigilant
watching for evidence of such a trend change

Jay


Monday is a bank holiday

Jay

Thursday, October 07, 2010

General road map for next 6 months


TYPO- sorry ,did not proof read, got distracted- sh happens.

It was 528 tr days from SPT 2nd, 2008 at OPEN dow @ 11,790
to Oct 6th at OPEN dow @ 10,998


IT WILL BE 528 tr days from MARCH 9th, 2009 to March 28th 2011

Thanks for pointing out my error, & SOME of you picked up the RIGHT
dates immediately while others,---- well we wont say any more.

Just Coincidence ?? maybe For educational purposes, maybe.

Can we USE this knowledge?

Not today, but the graph might be useful
some did not like it and compared it to an EKG--
ooohh, thats what its supposed to look like.

Jay

Oct7th EKG


Jay

Wednesday, October 06, 2010

October 6th EKG

Futures fell off earlier AM highs
After 9am, the energy turns negative thru Mid day on Friday, but that remains to
be seen if there is any effect on stocks

Has wave "C" peaked?

Flux indicator WILD for second day ina row- usually means something is about to happen
and IF we have topped out, then the first wave down in a series thru FEB 2nd should show up NOW

Jay

Jay

Tuesday, October 05, 2010

October 2010

One web site I was just viewing makes a good case for a 1987 type crash, but I really dont think thats what we have going this month

It looks like we will make a 4 month correction into Feb 2nd as the pivot low
but more about that later

Jay

October 5th comments

Chart from Columbia

COMPARE TODAY to August 9th

EKG not available so far today

Today's open seems VERY SIMILAR to AUGUST 9th
Appears as a Possible 5th wave right back to the 1150/52 area
and is occurring right at the 13hr cycle at 10am

NOW, I think I know WHY the WARNING - dont follow the crowd
We had the SAME reading on AUGUST 10th- dont follow the crowd
It was not indicating a bottom, but a PEAK as on August 9th

If we follow a similar pattern, we should see a
LOW on the 8th
10am =39hrs from the 1158 high
10:42 am = 38.2%/13 day cycle
150bars at 11am
All clustered in the same time zone

And after a brief rebound next week thru the 15th-18th
the end of the month {28th} should reach a tradable pivot for a stronger rebound in Nov.

Jay

Monday, October 04, 2010

UPDATE

Internals show a strong sell off is imminent as I posted from my spreadsheet

Question next is WHEN & where is support
Now to 7th @ new moon @2:45pm might be a good start
980 appears as a line extending the lows of May6 Spx1066 to July1st spx 1010

It seems a little too much to expect but IF the Low of wave "C" or "3" is going to reach a projected low of about spx 800, EVENTUALLY, or withing the next 4 months.

One thing about the astro that seems to be making an impact is the Huge Cluster
of last wkend in North declination, and the CHANGE of ALL planets into the south declination from Oct6th to Feb 11th

the PEAK also came at 110 tr days from APR 26th high along with that cluster
then Add Stan Harleys TURN date- oct 1, and JerrR peak of 1158 on the 30th
financials getting hit today
WELL it does seem to add up to SELL

A few astro events lined up on MAY6th including some planetary contras & the day
indicated something was off kilter as the flash crash sure proved.

Now we have some lunar contras occurring tomrrow
some lunar oppositions on Wed
And new moon on Thsday, enhanced with Merc 0 Saturn & a parallel of the pair
which seems to indicate disruptions
Flash tells us to look for a turn on the 8th, and since thats after the new moon, and the above aspects, then I tend to agree with him as its ALSO 488 tr days from OCT27th, 2008= 61cycles of 8
& Friday is 400 tr days from MAR 9th = 50 cycles of 8

IMO, IT comes down to this FOR THIS WEEK at least
If tomrrow duplicates May6th in any way whatsoever, we will KISS the bear
as he rages, but this time they wont recover like May6th, but make its lows
as above on the new moon Thsday, AT WHATEVER price level they get to
even if not 980 as projected above

Jay

Sunday, October 03, 2010

Oct 4th EKG and more

Not exactly what was projected but not bad either
Jay
This is a PRELIMINARY view of tomrrow's EKG published at 6pm Sunday
we'' see if it STILL holds true at 8:30am

CYCLES this week
Monday
Midnite low tide
156 bars @ 4pm

Tuesday
13 hrs @ 10am
14.6%/13 day at 10:20am
180bars at 11am
488/8 = 61 cycles from Oct27th, 2008

Wed
Positive energy at 9:02am
Pos energy at 9:49am
Neg energy at 10:12
Neg energy @ 12:45- 1:00pm
258bars @ 11:30am
Neg energy at 8:30pm

Ths
26hrs at 10am
400 days Mar 9 = 50 cycles of 8
120bars @ 3pm
New moon at 2;45pm= shift in energy = a fresh start

Fri

Pos energy day
38.2%/13day at 10:42am
150bars @ 11am

Monday looks for a strongly positive day.

Compare the above with the energy outlook and daily bias on the previous post.
IMO, it seems to indicate a strong sell off Monday, overriding into tuesday between 10& 11am.
An afternoon rebound continues into Wed till 10am, then lower for the day, ending on
Thsday at 10am, and moving ahead after 2;30 picking up steam on Friday and making a stronger run on Monday

Jay

Energy this week

Monday = Negative
Tuesday = mixed
Wed = mixed
thsday = mixed
Friday = positive

__________

Monday
Wrong $$ messages
Today is like walking thru a minefield

Tuesday
Get an early start
Give & take thru first half of day
mid day find support
$$ improves

Wed
Am OK
PM= power struggles

Thsday
Stress & turbulence
fresh start after new moon

Friday
$ luck brightens the day

Jay

Friday, October 01, 2010

More than MUMBO JUMBO

I published MY PROPRIETARY spread sheet data b4 but heres an update


DATE ----ADV/DEC ----Volume-----Adv /DEC 5------Vol 5----Arms 10
SPT9th------- 1495 -------- 4293 ---------299-----------858
Oct1 ----------758---------- 877-----------151------------175

Usually we get a decline in those values as the mkt falls, but this
one is 500 pts above that SPT9th date

How do you think the MKT is going to EQUALIZE those values with PRICE
come Monday Oct4th & part of the 5th & on thru the 7th new moon late afternoon

Keep in mind that the THRESHOLD for BUYS on the
FIRST 2 sets of a/d & Vol are under 400.
usually a reading under 300 for 2 to 3 days gets us a rally.

I'll report on that next week

Jay

Oct 1st EKG & comments

I DONT KNOW HOW MUCH MORE ANYONE could ASK FOR
this EKG INDICATOR posted at 8:30 EVERY MORNING is INCREDIBLE
70% DAILY Accuracy for the DAY AHEAD since inception March 24th
Jay
Last day of Month & first day of new month have usually been positive

late energy today supports the mkt for today

IS today a TOP for now or at least for the month of October?

Low volume all month also shows up in my proprietary tracking.
Adv Decl & vol peaked SPT 9th, and have been lagging since.

the Usual HIGH around the 20th - 23rd has extended to the EOM,
but what does that say about the USUAL lows on the 1st to 4th
of each month as we have seen since March 9, 2009?

It would seem to say those dates will ALSO be extended

The NEW moon is on the 7th, and is indicating a fresh start

NOW this dosent mean we go STRAIGHT down to the 7th - OH NO
much more choppy than that, for sure.

_____________________________
UPDATE

13 day cycle at 11am brot the mkt back off its opening high
Activity index was at 100 all day yesterday and at noon is at 66, near its lowest possible level @ 33

258bars at 4pm yesterday indicated a big open today
30bars@ noon hit but muted
60bars @ 2;30
90bars at 10am Monday

we are 750 tr days from October 10th, 2007 high
Break that down as follows
250 tr days back to 10/2/09, a LOW
500 tr days back to 10/10/09, a low
750 days is obviously NOT a low, but is it a high?

lots of technical evidence around to indicate the rally cant continue without
a set back, and some techs looking at 1110 for support, but the most recent
support cane at 1122.

Jay