 WAVES 1 AND 2
If wave 2 is completed, then there is NO TURNING BACK TOMRROW
Jay


 What level would it take for the month of SPT to hold its TITLE
 Another success
 Dollar coming off lows ???
 Darn Straight
 just as projected by the Power graph, we seem to have a day that goes no where
 ITS NOW 4pm, and FINALLY, they gave some back- the graph indicates more, but we will take it for now.
 NOT TOO BAD overall
 1942 to 2012 and we are fast approaching
  An attempt to match up these 2 charts or overlay might or might not indicate a brief sell off
 Heres a chart of the dow from 1936 to 1942
 from Columbia's public charts
 This came to my attention
 FRED
FRED This counts out more clearly as 5 waves from 1148 to 1122.79 on close
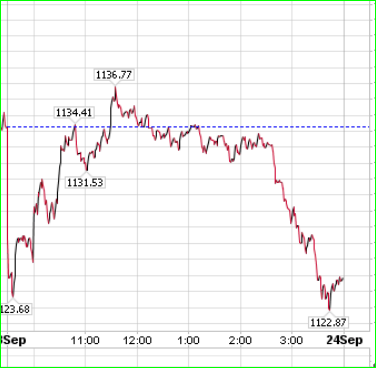 COMPARE to EKG below
 graph from Columbia's public charts
 FYI- I thought this might be important to see NOW
 yesterday was an 8 day high, but one day late for the averages,
  NOTE on 23rd- LOOKS LIKE 22nd & 23rd maybe reversed
 NEARLY PERFECT - STILL at 70%, and I dont really expect it to get any better than that
 Looks about the same as yesterday
 MY proprietary ADV decl & volume indicators are screaming SELL
 As previously indicated
 No one can really know when this wave will end but the evidence suggests there could be a break this week.
 NOT great, but not too bad either- could count it either way
 Heres a MORE complete view of today's EKG
 JUSt as projected by the POWER index, we see the DAILY EKG confirming TOMRROW
 For comparison, we can see the OBV not keeping pace with the rise in stock prices at he end of the day. And so far the AM futures indicate an open at 1130 prior to 8:30.
 Once again we see the PROBLEM associated with the CLOSE of the day verses the data STREAM which is continuous- WHERE to cut if off ??
 As we can see, the end of day today "" SHOULD"" sell off into tomorrow at 10am as the SNEAK PREVIEW indicates - Jay
 Late sell off is indicated leading to a LOWER OPEN on Friday
 OK AGAIN
 Let me KNOW if you want me to continue with the DAILY EKG
 Couldnt ask for anything better
 Today's cycles
 NOT EXACT, but how could anyone expect 100%
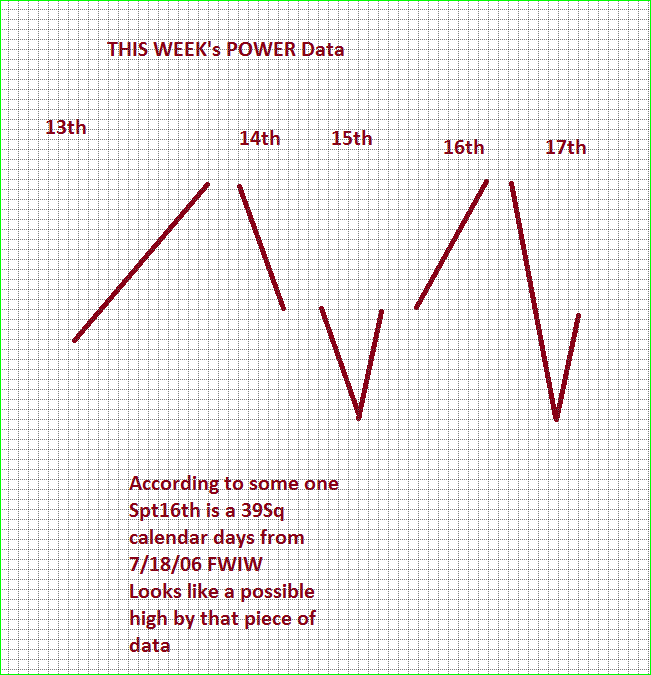 Some one suggested that BECAUSE we have not seen a 20% sell off as of Spt 13th,
 Ive seen a similar chart at another site which also shows what some are labeling as wave 2
 Is there REALLY going to be any set back, ??
 Didnt finish as low as pictured, but I really didnt expect it to, unless Monday
 Much to do about nothing
 60bars at 11am
 Couldn't ask for a better depiction of today's action
 Looks like today is day ON HOLD